我有一些wav文件。我想使用SciPy FFT绘制这些wav文件的频谱。如何做到这一点?
2个回答
83
Python提供了几个API可以快速完成这个任务。我从这个链接下载了sheep-bleats的wav文件。你可以将它保存在桌面上,然后在终端中使用cd命令进入该目录。下面这些python提示符中的代码应该就足够了:(省略>>>)
import matplotlib.pyplot as plt
from scipy.fftpack import fft
from scipy.io import wavfile # get the api
fs, data = wavfile.read('test.wav') # load the data
a = data.T[0] # this is a two channel soundtrack, I get the first track
b=[(ele/2**8.)*2-1 for ele in a] # this is 8-bit track, b is now normalized on [-1,1)
c = fft(b) # calculate fourier transform (complex numbers list)
d = len(c)/2  # you only need half of the fft list (real signal symmetry)
plt.plot(abs(c[:(d-1)]),'r')
plt.show()
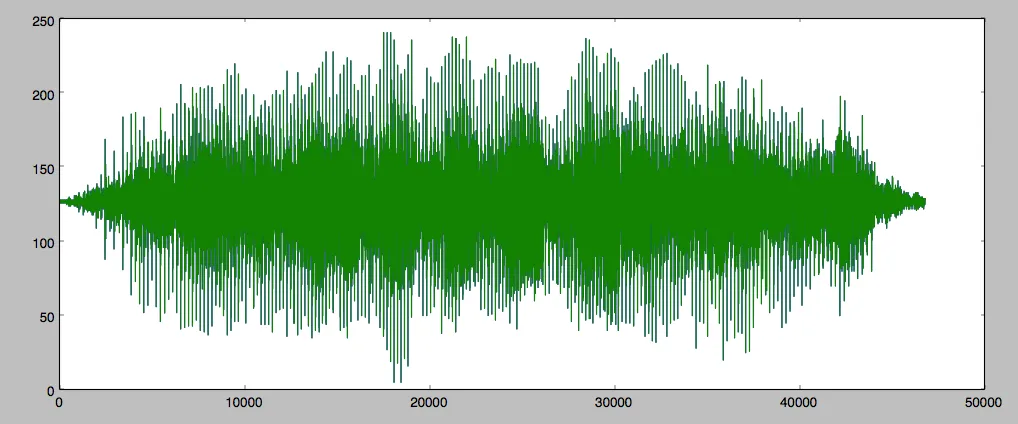
以下是输入信号的图表:
以下是频谱图: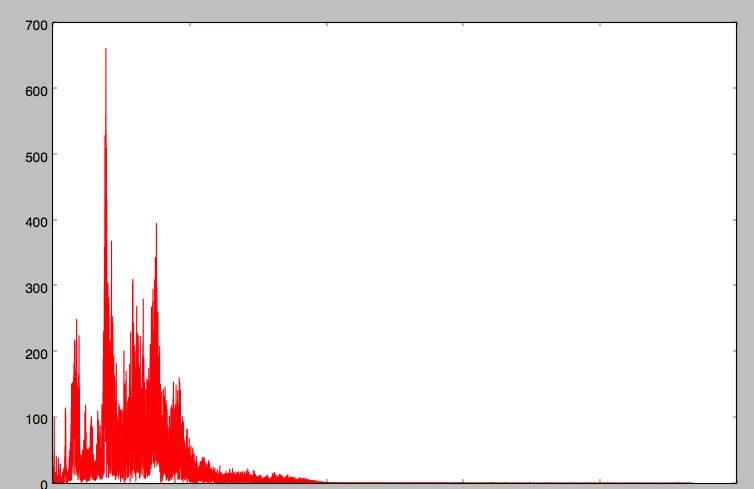
为了正确的输出结果,您需要将 xlabel 转换为频率以匹配频谱图。
k = arange(len(data))
T = len(data)/fs  # where fs is the sampling frequency
frqLabel = k/T
如果你需要处理大量的文件,可以将其实现为一个函数: 将以下代码放入
test2.py:import matplotlib.pyplot as plt
from scipy.io import wavfile # get the api
from scipy.fftpack import fft
from pylab import *
def f(filename):
fs, data = wavfile.read(filename) # load the data
a = data.T[0] # this is a two channel soundtrack, I get the first track
b=[(ele/2**8.)*2-1 for ele in a] # this is 8-bit track, b is now normalized on [-1,1)
c = fft(b) # create a list of complex number
d = len(c)/2 # you only need half of the fft list
plt.plot(abs(c[:(d-1)]),'r')
savefig(filename+'.png',bbox_inches='tight')
假设我在当前工作目录下有
test.wav和test2.wav两个文件,以下是在Python交互界面中执行的命令:
import test2
map(test2.f, ['test.wav','test2.wav'])如果你有100个这样的文件,并且不想逐个输入它们的名称,你需要使用
glob包:import glob
import test2
files = glob.glob('./*.wav')
for ele in files:
f(ele)
quit()
如果您的.wav文件不是相同的位数,则需要在test2.f中添加getparams。
(注:本句中的html标签已保留,无需翻译)
- yshk
14
5好的回答!您可能需要删除
>>>,这样OP和其他人可以复制和粘贴。另外,如果您的代码生成了一个图表,那么包含一张图片可以帮助回答。 - Hooked1你如何将多个wav文件连接起来?我有很多小的wav文件。 - user1802143
4这句话的意思是:将代码中的
a = data.T[0] 改成 a = data.T[0:data.size]。修改后的代码会选择 data 数组的前 data.size 个元素并将其转置赋值给变量 a。 - Darleison Rodrigues1d = len(c)/2 是一个浮点数,会抛出 TypeError: slice indices must be integers or None or have an index method。难道你不应该将它转换为整数吗? - Boris
2@Boris,Pythonic 的做法是
d = len(c) // 2,它可以直接执行整数除法并避免了任何需要转换结果的需求。考虑到这个答案的年龄,它很可能是针对 Python2 写的,在那个时候,如果两个操作数都是整数,整数除法是标准的。在 Python3 中,默认情况下使用浮点数除法。 - alkanen显示剩余9条评论
16
您可以使用以下代码进行转换:
#!/usr/bin/env python
# -*- coding: utf-8 -*-

from __future__ import print_function
import scipy.io.wavfile as wavfile
import scipy
import scipy.fftpack
import numpy as np
from matplotlib import pyplot as plt

fs_rate, signal = wavfile.read("output.wav")
print ("Frequency sampling", fs_rate)
l_audio = len(signal.shape)
print ("Channels", l_audio)
if l_audio == 2:
    signal = signal.sum(axis=1) / 2
N = signal.shape[0]
print ("Complete Samplings N", N)
secs = N / float(fs_rate)
print ("secs", secs)
Ts = 1.0/fs_rate # sampling interval in time
print ("Timestep between samples Ts", Ts)
t = scipy.arange(0, secs, Ts) # time vector as scipy arange field / numpy.ndarray
FFT = abs(scipy.fft(signal))
FFT_side = FFT[range(N/2)] # one side FFT range
freqs = scipy.fftpack.fftfreq(signal.size, t[1]-t[0])
fft_freqs = np.array(freqs)
freqs_side = freqs[range(N/2)] # one side frequency range
fft_freqs_side = np.array(freqs_side)
plt.subplot(311)
p1 = plt.plot(t, signal, "g") # plotting the signal
plt.xlabel('Time')
plt.ylabel('Amplitude')
plt.subplot(312)
p2 = plt.plot(freqs, FFT, "r") # plotting the complete fft spectrum
plt.xlabel('Frequency (Hz)')
plt.ylabel('Count dbl-sided')
plt.subplot(313)
p3 = plt.plot(freqs_side, abs(FFT_side), "b") # plotting the positive fft spectrum
plt.xlabel('Frequency (Hz)')
plt.ylabel('Count single-sided')
plt.show()
- bunkus
2
11它运行得很好。
但是,你需要修复除法运算符;
将 N/2 改为 N//2,
因为那个操作会创建一个浮点数。 - pbgnz
2@pbgnz 仅适用于Python 3,或者如果您在Python 2中使用了
from __future__ import division。 - supergra网页内容由stack overflow 提供, 点击上面的可以查看英文原文,
原文链接
原文链接