创建一个ASCII艺术世界地图

5

我希望能够使用这个GeoJSON文件来呈现一个ASCII艺术世界地图。

我的基本方法是将GeoJSON加载到Shapely中,使用pyproj将点转换为墨卡托投影,然后对我的ASCII艺术网格的每个字符的几何图形进行命中测试。

当位于本初子午线上时,它看起来(编辑:大部分)还可以:

centered at lon = 0

但是以纽约市为中心(lon_0=-74),它突然失控了:

enter image description here

我相当确定在这里的投影方面做错了些什么。(而且将ASCII地图坐标转换为纬度/经度可能比转换整个几何形状更有效,但我不确定如何操作。)

import functools
import json
import shutil
import sys

import pyproj
import shapely.geometry
import shapely.ops


# Load the map
with open('world-countries.json') as f:
  countries = []
  for feature in json.load(f)['features']:
    # buffer(0) is a trick for fixing polygons with overlapping coordinates
    country = shapely.geometry.shape(feature['geometry']).buffer(0)
    countries.append(country)

mapgeom = shapely.geometry.MultiPolygon(countries)

# Apply a projection
tform = functools.partial(
  pyproj.transform,
  pyproj.Proj(proj='longlat'),  # input: WGS84
  pyproj.Proj(proj='webmerc', lon_0=0),  # output: Web Mercator
)
mapgeom = shapely.ops.transform(tform, mapgeom)

# Convert to ASCII art
minx, miny, maxx, maxy = mapgeom.bounds
srcw = maxx - minx
srch = maxy - miny
dstw, dsth = shutil.get_terminal_size((80, 20))

for y in range(dsth):
  for x in range(dstw):
    pt = shapely.geometry.Point(
      (srcw*x/dstw) + minx,
      (srch*(dsth-y-1)/dsth) + miny  # flip vertically
    )
    if any(country.contains(pt) for country in mapgeom):
      sys.stdout.write('*')
    else:
      sys.stdout.write(' ')
  sys.stdout.write('\n')


4
如果不算加拿大,排名第一看起来还不错。 - philshem
2
我忘记在我的虚拟环境中安装Canada。 - rgov
需要坚持使用Shapely和Pyproj吗? - Martin
我有一个快速处理方案,可以将国家边界转换为图像坐标。这意味着您没有多边形,只有边界 - 这看起来不太好,因为在ASCII图像中有很多空白区域。此外,您需要对图像坐标进行一些小的校正,因为我不了解地图制图学,也不知道经度等如何转换为2D。我认为唯一的依赖是numpy。您对这样的解决方案感兴趣吗? - Martin
2
第二个看起来好像你忘记考虑到了反子午线,并且线条连接的方式是“错误”的。 - Ian Turton
显示剩余3条评论
1个回答

5

我在底部进行了编辑,发现了新问题(为什么没有加拿大和Shapely和Pyproj的不可靠性)


尽管这种方法并没有完全解决问题,但我认为这种态度比使用pyproc和Shapely更具潜力。如果您将来需要制作更多的ASCII艺术品,这种方法将为您提供更多的可能性和灵活性。首先,我将列出优缺点。
PS:起初我想在您的代码中找到问题,但是我在运行它时遇到了一些pyproj返回的错误。 优点 
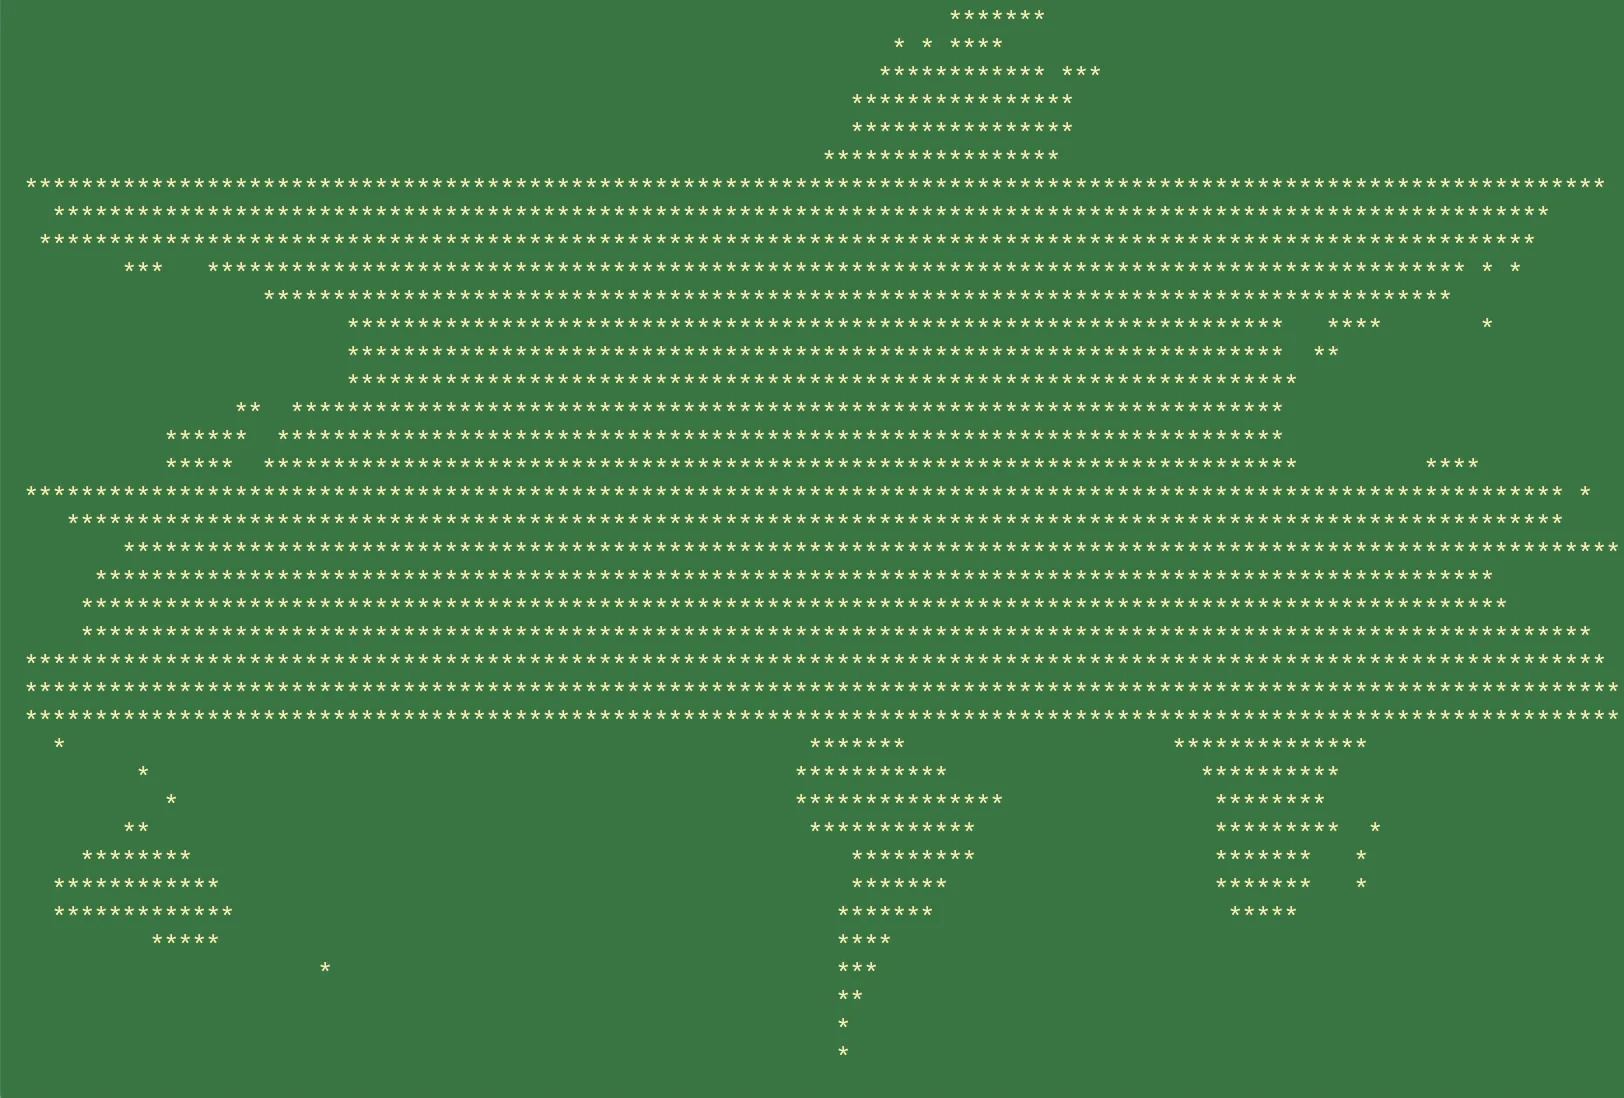
1)我能够提取所有点(加拿大确实缺失)并旋转图像
2)处理速度非常快,因此可以创建动画ASCII艺术品
3)打印一次完成,无需循环 缺点(已知问题,可解决) 1)这种方法明显不能正确地转换地理坐标-太平面了,应该看起来更球形
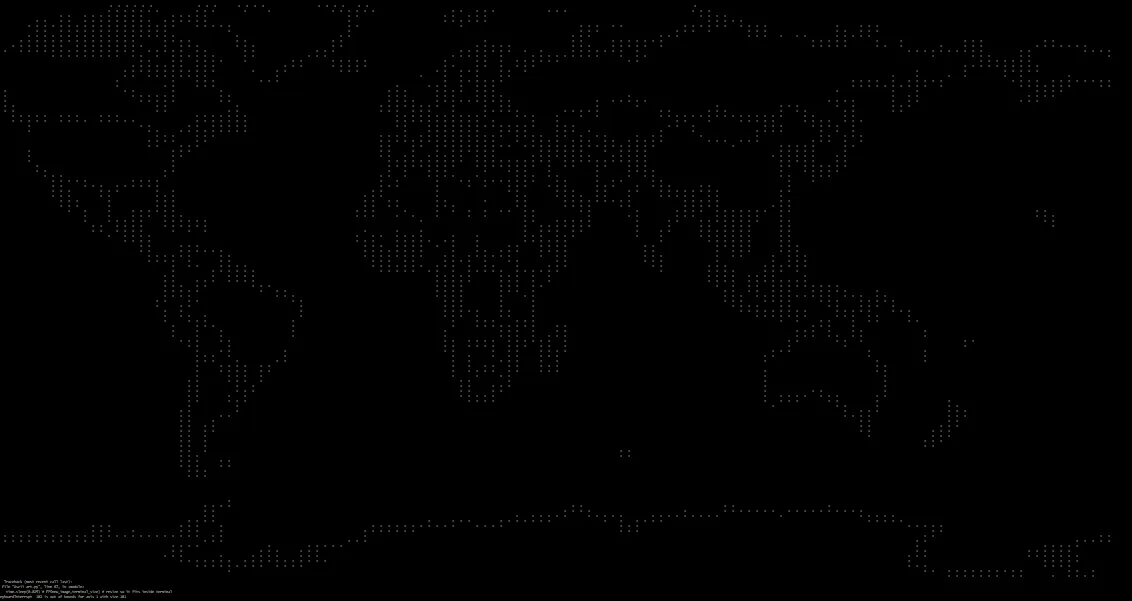
2)我没有花时间去尝试找到填充边界的解决方案,因此只有边界上有“*”。因此,这种方法需要找到算法来填充国家。我认为这不应该是问题,因为JSON文件包含分离的国家。

3) 除了numpy之外,您还需要两个额外的库 - opencv(您可以使用PIL代替)和Colorama,因为我的示例是动画的,我需要通过将光标移动到(0,0)来“清除”终端而不是使用os.system('cls')

4) 我只使其在python 3中运行。在python 2中也可以工作,但我遇到了sys.stdout.buffer错误

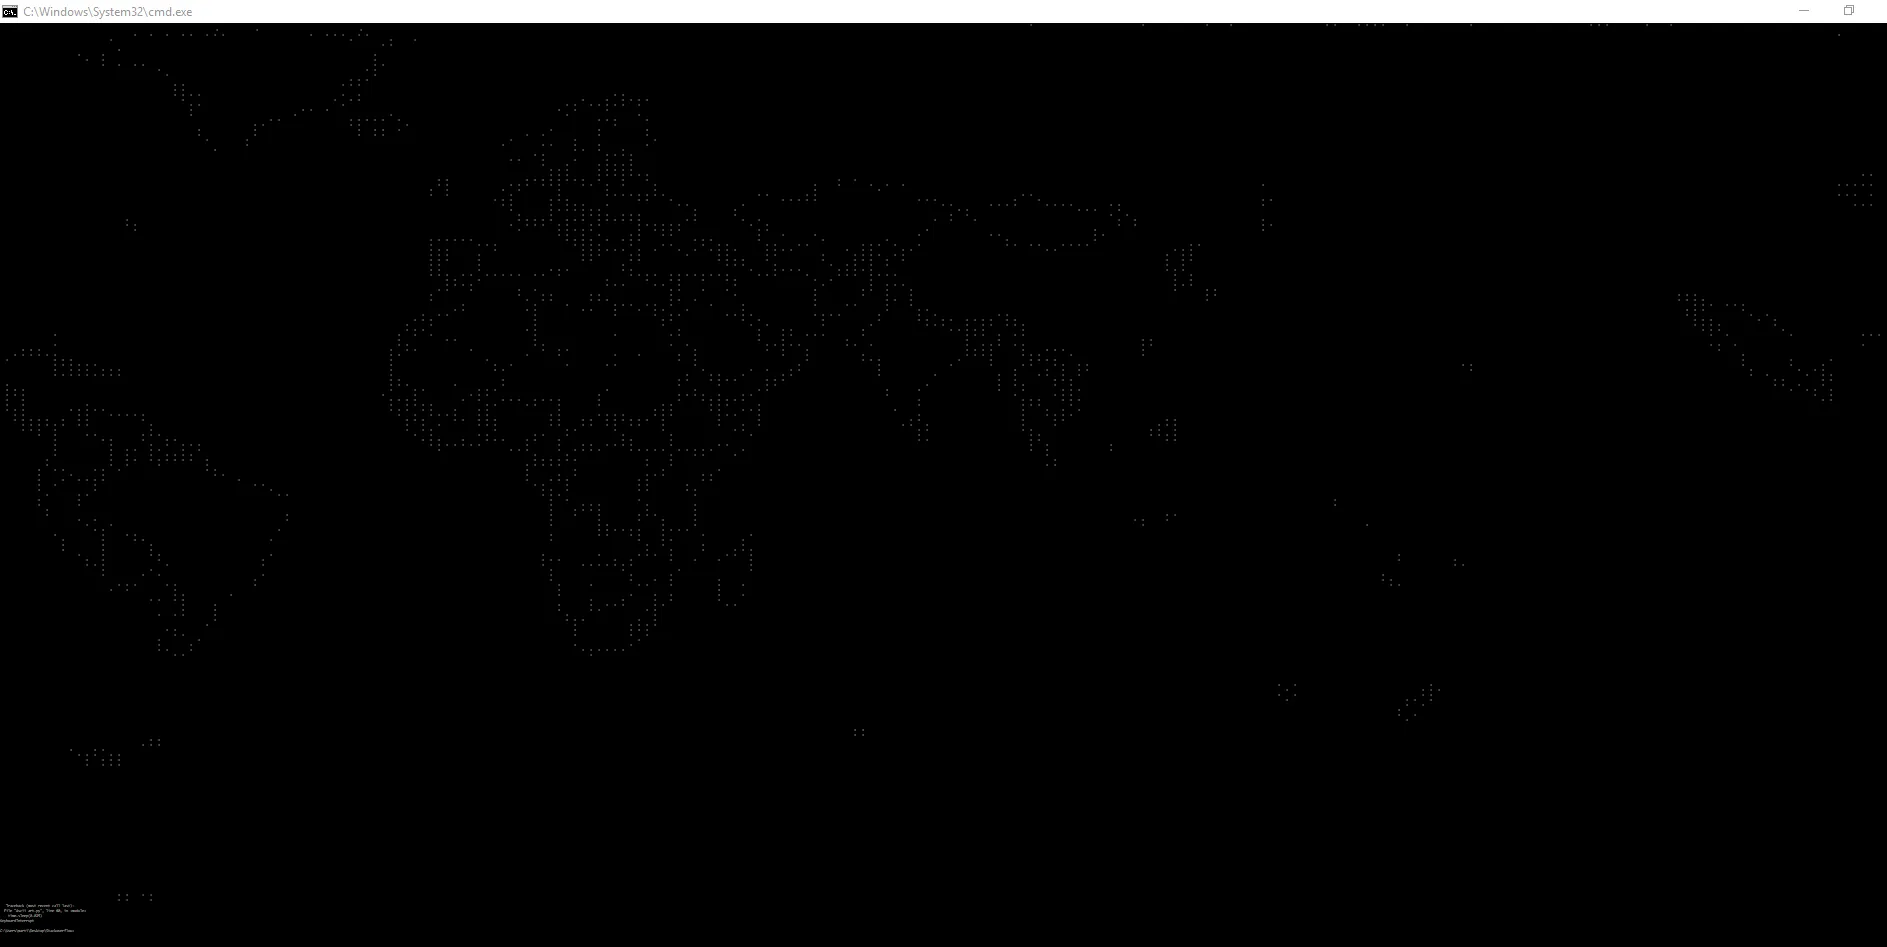
将终端上的字体大小调整到最低点,以便打印的字符适合终端。字体越小,分辨率越高

动画应该看起来像地图正在“旋转” enter image description here

我使用了一点你的代码来提取数据。步骤在注释中

import json
import sys
import numpy as np
import colorama
import sys
import time
import cv2

#understand terminal_size as how many letters in X axis and how many in Y axis. Sorry not good name
if len(sys.argv)>1:   
    terminal_size = (int(sys.argv[1]),int(sys.argv[2]))
else:
    terminal_size=(230,175)
with open('world-countries.json') as f:
    countries = []
    minimal = 0 # This can be dangerous. Expecting negative values
    maximal = 0 # Expecting bigger values than 0
    for feature in json.load(f)['features']: # getting data  - I pretend here, that geo coordinates are actually indexes of my numpy array
        indexes = np.int16(np.array(feature['geometry']['coordinates'][0])*2)
        if indexes.min()<minimal:
            minimal = indexes.min()
        if indexes.max()>maximal:
            maximal = indexes.max()
        countries.append(indexes) 

    countries = (np.array(countries)+np.abs(minimal)) # Transform geo-coordinates to image coordinates
correction = np.abs(minimal) # because geo-coordinates has negative values, I need to move it to 0 - xaxis

colorama.init()

def move_cursor(x,y):
    print ("\x1b[{};{}H".format(y+1,x+1))

move = 0 # 'rotate' the globe
for i in range(1000):
    image = np.zeros(shape=[maximal+correction+1,maximal+correction+1]) #creating clean image

    move -=1 # you need to rotate with negative values
    # because negative one are by numpy understood. Positive one will end up with error
    for i in countries: # VERY STRANGE,because parsing the json, some countries has different JSON structure
        if len(i.shape)==2:
            image[i[:,1],i[:,0]+move]=255 # indexes that once were geocoordinates now serves to position the countries in the image
        if len(i.shape)==3:
            image[i[0][:,1],i[0][:,0]+move]=255


    cut = np.where(image==255) # Bounding box
    if move == -1: # creating here bounding box - removing empty edges - from sides and top and bottom - we need space. This needs to be done only once
        max_x,min_x = cut[0].max(),cut[0].min()
        max_y,min_y = cut[1].max(),cut[1].min()


    new_image = image[min_x:max_x,min_y:max_y] # the bounding box
    new_image= new_image[::-1] # reverse, because map is upside down
    new_image = cv2.resize(new_image,terminal_size) # resize so it fits inside terminal

    ascii = np.chararray(shape = new_image.shape).astype('|S4') #create container for asci image
    ascii[:,:]='' #chararray contains some random letters - dunno why... cleaning it
    ascii[:,-1]='\n' #because I pring everything all at once, I am creating new lines at the end of the image
    new_image[:,-1]=0 # at the end of the image can be country borders which would overwrite '\n' created one step above
    ascii[np.where(new_image>0)]='*' # transforming image array to chararray. Better to say, anything that has pixel value higher than 0 will be star in chararray mask
    move_cursor(0,0) # 'cleaning' the terminal for new animation
    sys.stdout.buffer.write(ascii) # print into terminal
    time.sleep(0.025) # FPS

也许解释一下代码中的主要算法会更好。我喜欢尽可能使用numpy。整个过程就是假装图像(或者在你的情况下是地理坐标)中的坐标是矩阵索引。我有两个矩阵 - 真实图像和作为掩模的Charray。然后,我取出真实图像中有趣像素的索引,并将任何想要的字母分配给Charray掩模中相同索引的位置。由于这样,整个算法不需要一个循环。
关于未来的可能性
假设您还将拥有关于地形(海拔)的信息。让我们说您以某种方式创建了世界地图的灰度图像,其中灰度色阶表示海拔高度。这样的灰度图像将具有形状x,y。您将准备一个形状为[x,y,256]的 3D 矩阵。对于3D矩阵中的256个图层中的每个图层,都会分配一个字母'....;;;;#等'来表示灰度色阶。 当您准备好后,可以获取您的灰度图像,其中任何像素实际上都具有3个坐标:x,y和灰度值。因此,您将从您的灰度地图图像中提取 3个索引数组-> x,y,shade。您的新charray将只是从带有图层字母的 3D矩阵中提取的内容,因为:
#Preparation phase
x,y = grayscale.shape
3Dmatrix = np.chararray(shape = [x,y,256])
table = '    ......;;;;;;;###### ...'
for i in range(256):
    3Dmatrix[:,:,i] = table[i]
x_indexes = np.arange(x*y)
y_indexes = np.arange(x*y)
chararray_image = np.chararray(shape=[x,y])

# Ready to print
...

shades = grayscale.reshape(x*y)
chararray_image[:,:] = 3Dmatrix[(x_indexes ,y_indexes ,shades)].reshape(x,y)

由于此过程中没有循环并且可以一次性打印chararray,因此您实际上可以使用巨大的FPS将电影打印到终端中。
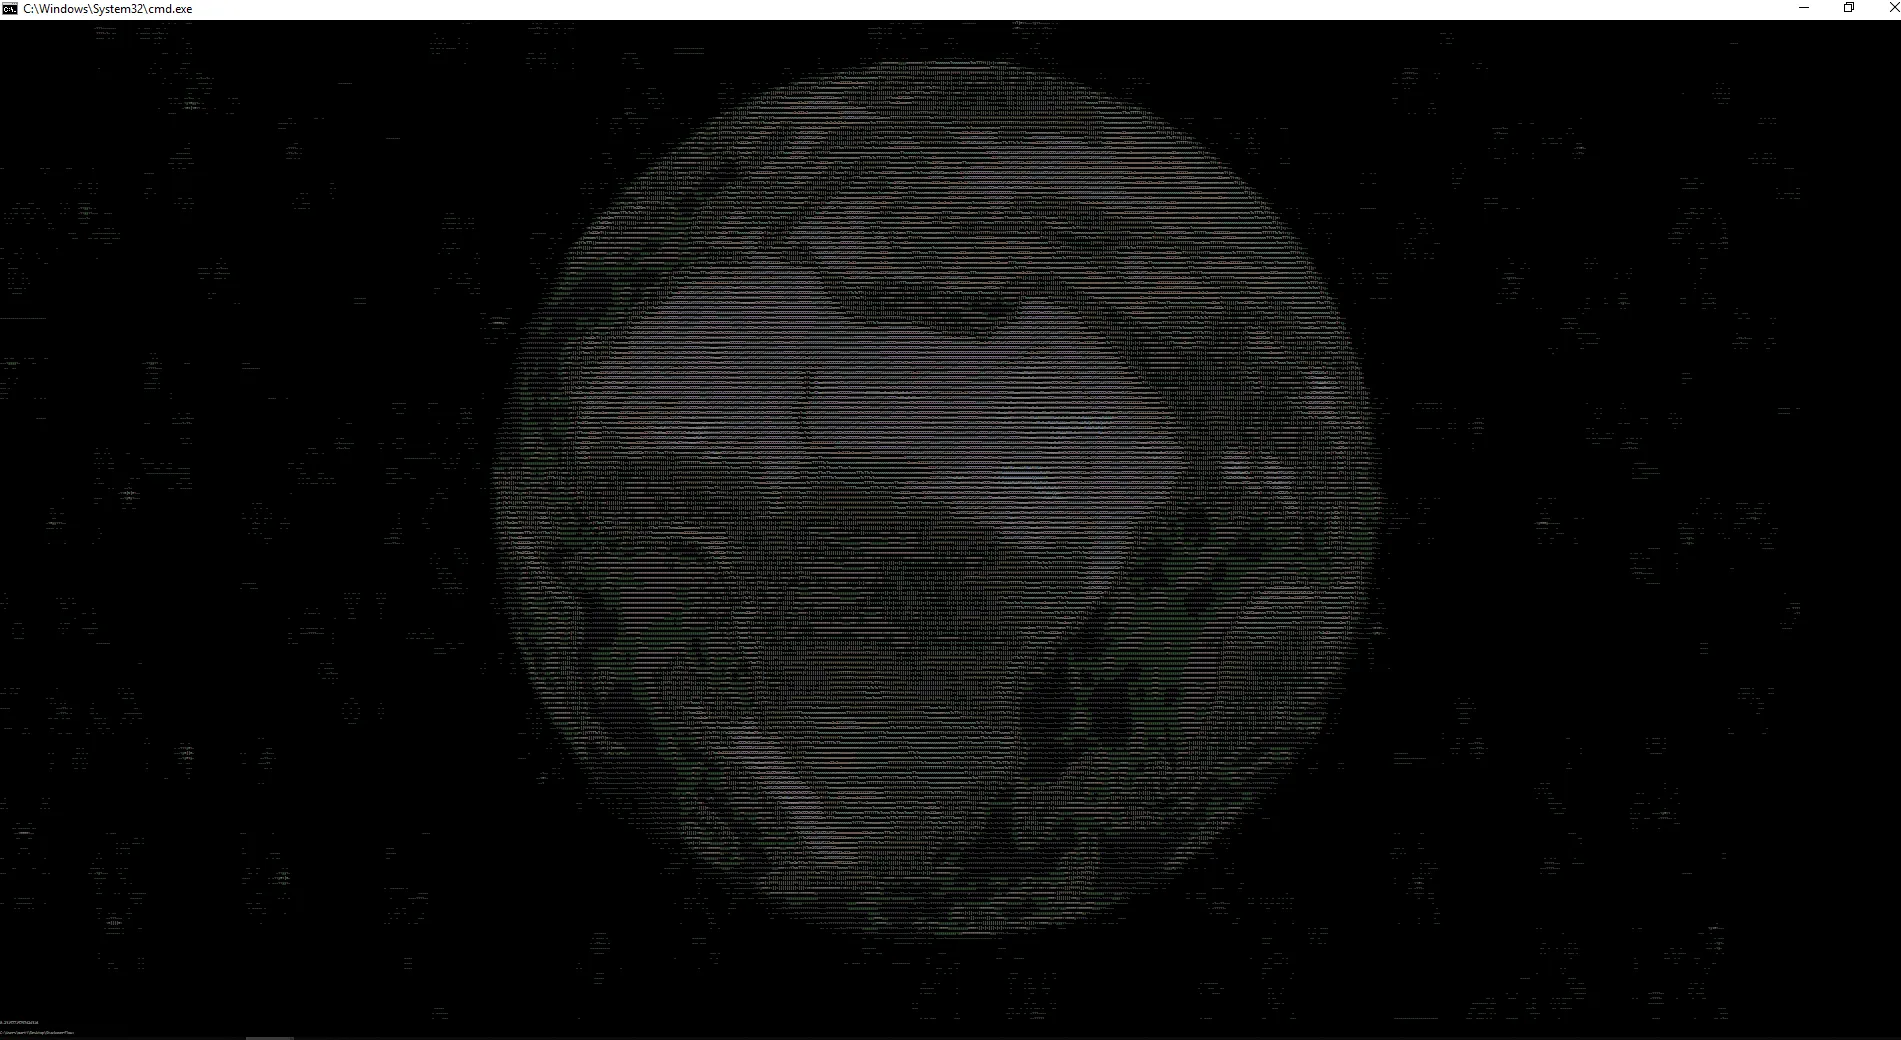
例如,如果您有旋转地球的镜头,您可以制作类似于这样的东西 - (250 * 70个字母),渲染时间为0.03658秒。

enter image description here

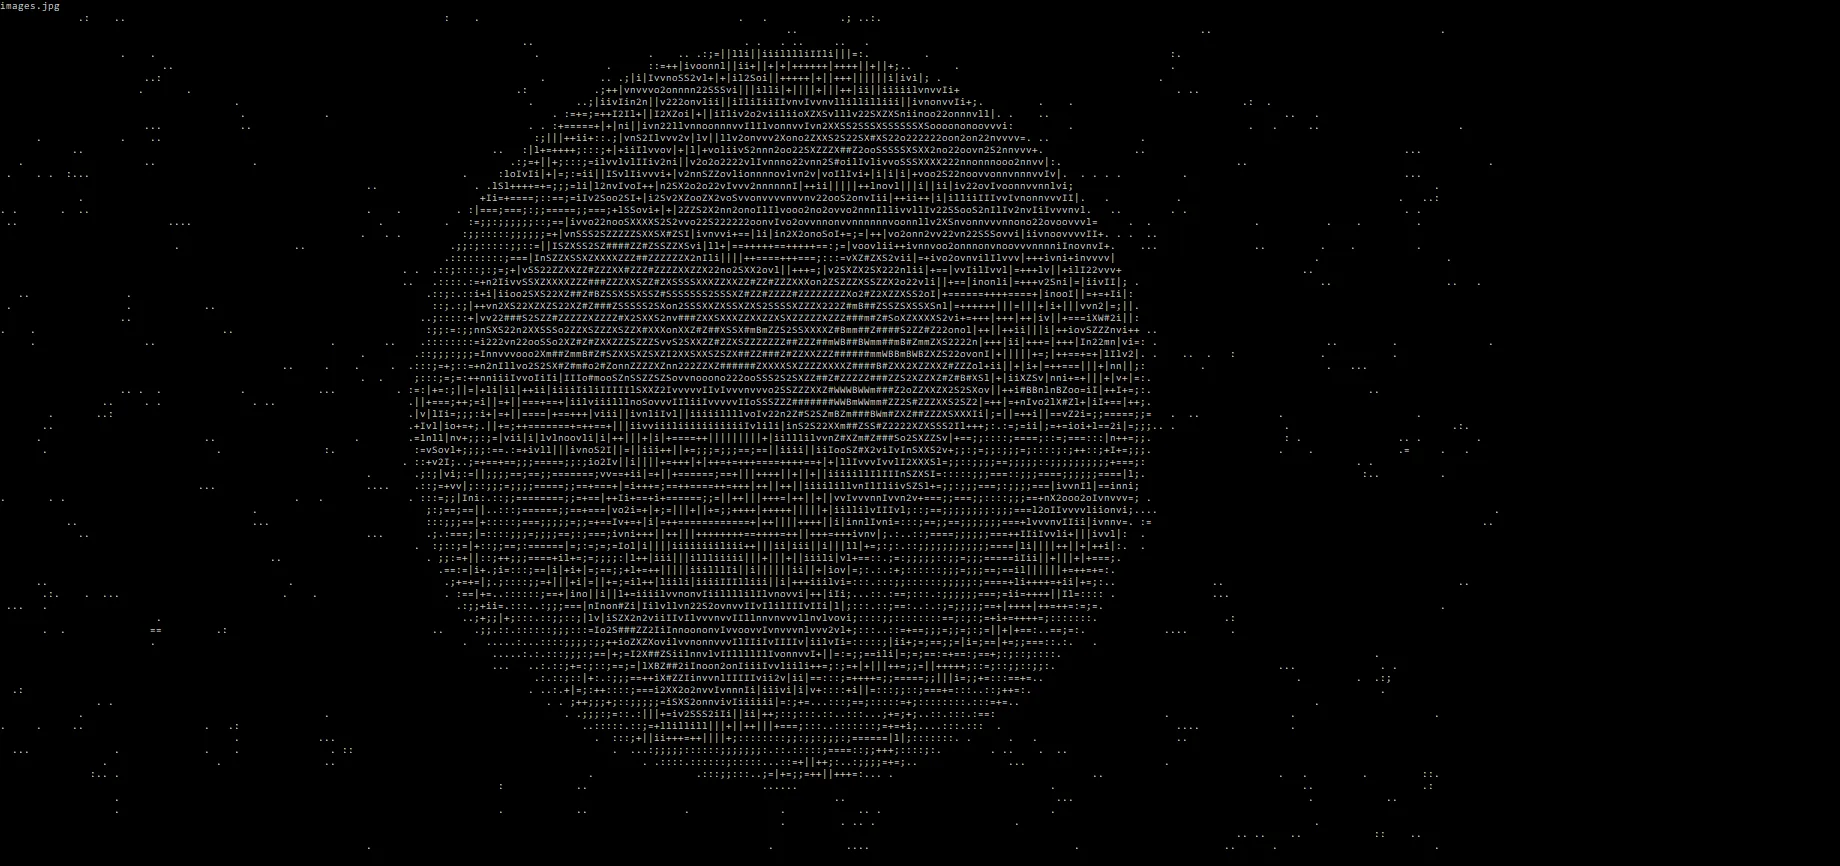
你当然可以在终端中将其提高到极致,实现超分辨率,但是结果的帧率并不好:0.23157秒,大约4-5 FPS。有趣的是,这个帧率非常高,但终端无法处理打印,因此这个低帧率是由于终端的限制而不是计算的限制,因为这个高分辨率的计算只需要0.00693秒,即144 FPS。

enter image description here


重要修改 - 与上面的某些陈述相矛盾

我不小心打开了原始的json文件,发现加拿大和俄罗斯都有完全正确的坐标。 我犯了一个错误,依赖于我们两个都没有在结果中看到加拿大,所以我认为我的代码没问题。在JSON内部,数据具有不同的非统一结构。俄罗斯和加拿大有“多边形”,因此您需要对其进行迭代。

这意味着什么? 不要依赖Shapely和pyproj。显然,它们无法提取一些国家,如果它们不能可靠地执行此操作,则不能指望它们执行更复杂的操作。

修改代码后,一切正常

代码:这是如何正确加载文件的方式

...
with open('world-countries.json') as f:
    countries = []
    minimal = 0
    maximal = 0
    for feature in json.load(f)['features']: # getting data  - I pretend here, that geo coordinates are actually indexes of my numpy array

        for k in range((len(feature['geometry']['coordinates']))):
            indexes = np.int64(np.array(feature['geometry']['coordinates'][k]))
            if indexes.min()<minimal:
                minimal = indexes.min()
            if indexes.max()>maximal:
                maximal = indexes.max()
            countries.append(indexes) 

...

enter image description here


网页内容由stack overflow 提供, 点击上面的
可以查看英文原文,
原文链接