将图例符号从geom_boxplot符号更改为正方形。

4

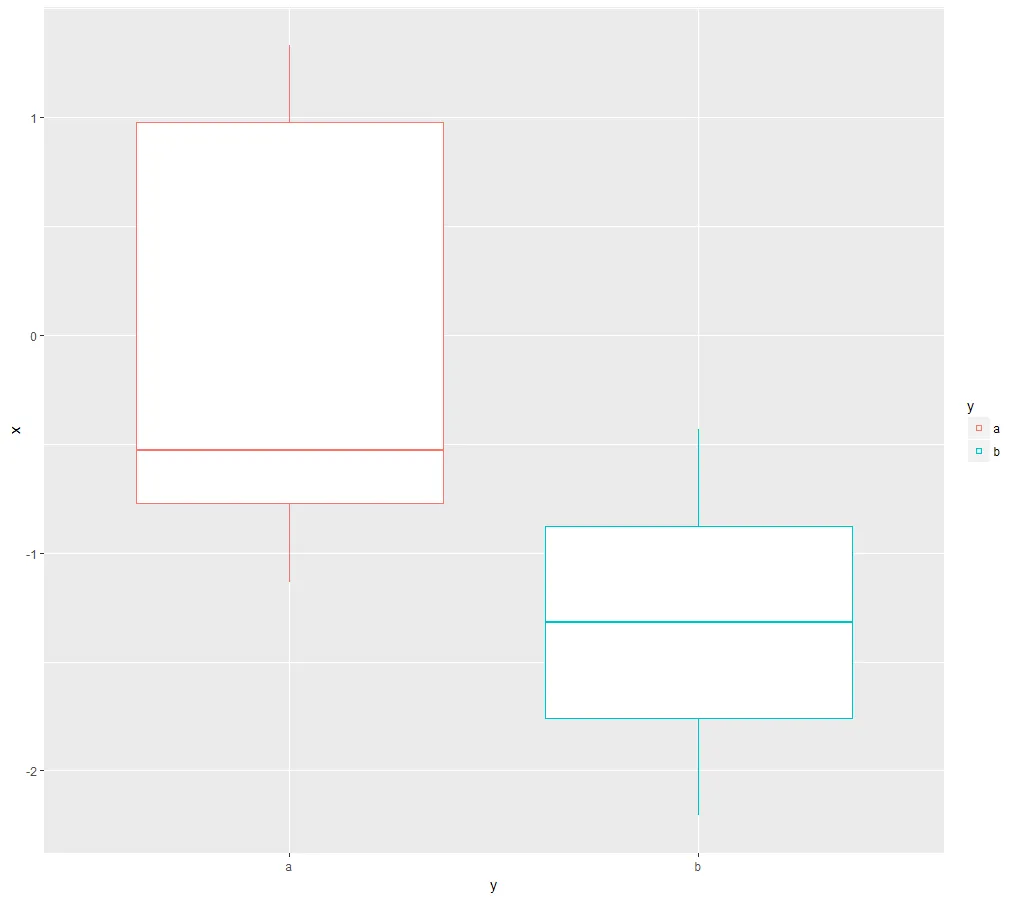
我可以更改箱线图图例中使用的符号吗?我想使用一个正方形代替默认的箱线图符号。经过一些搜索后,我尝试了以下内容,但最后一行似乎没有效果:

df = data.frame(x = rnorm(10), y = sample(letters[1:2], 10, TRUE))
library(ggplot2)
ggplot(df, aes(y, x)) +
geom_boxplot(aes(color = y)) +
guides(fill = guide_legend(override.aes = list(shape = 22)))

原因是在此图表左边还有另一个使用相同颜色但是以点而非箱线图表示的图表,因此我希望能有一个适用于两者的图例。

2个回答

3
不太美观,但你可以这样来进行hack:
library(dplyr)
library(ggplot2)

set.seed(42)
df <- data.frame(x = rnorm(10), y = sample(letters[1:2], 10, TRUE))

df_sum <- df %>% group_by(y) %>% summarize(mean_x = mean(x))

ggplot(df, aes(y, x)) +
  geom_point(data = df_sum, aes(y, mean_x, color = y), shape = 22) +
  geom_boxplot(aes(color = y), show.legend = F) 

enter image description here


3

我想实现你想要的功能可能有多种方法,但我通常的做法是:

  1. 去掉箱线图的图例
  2. 添加尺寸为 0geom_point
  3. 更改 geom_point 的图例而不是 geom_boxplot 的图例

代码:

df <- data.frame(x = rnorm(10), 
                 y = sample(letters[1:2], 10, TRUE))

library(ggplot2)
ggplot(df, aes(y, x, color = y)) +
    # Add dummy point layer with invisible points (size 0)
    geom_point(size = 0, shape = 22) +
    # Don't show legend
    geom_boxplot(show.legend = FALSE) +
    # Increase point size
    guides(color = guide_legend(override.aes = list(size = 10)))

结果:

在此输入图片描述


可以,谢谢。不过它只给了我一个框架,填充的框会更好看。但是当我把“color = y”改成“fill”时,在图例中只有小点。嗯... - ShellfishGene
1
搞定了,"color = y" 放在顶部,"fill = y" 在 geom_point() 语句中。 - ShellfishGene

网页内容由stack overflow 提供, 点击上面的
可以查看英文原文,
原文链接