我正在尝试使用scale_fill_manual在ggplot2中更改条形图的颜色,但由于某种原因,只有在内部使用美学选项中的填充选项才起作用。 我做了一个例子:
library(ggplot2)
library(dplyr)
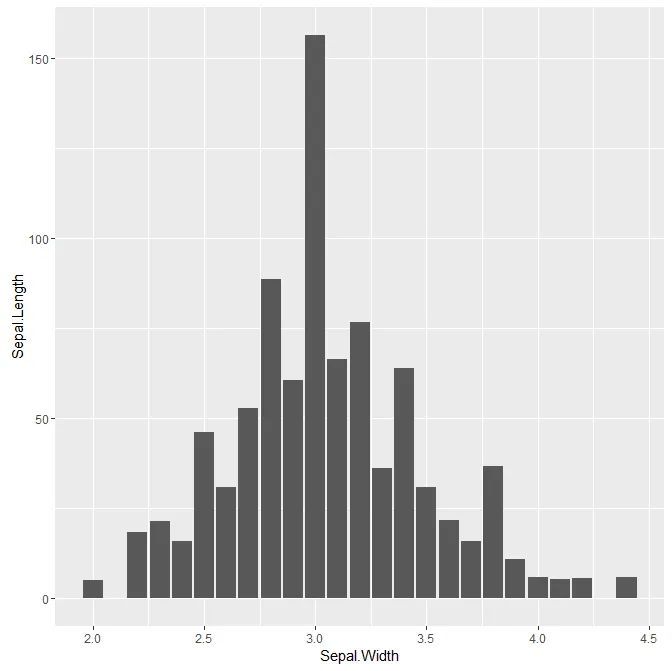
iris %>% ggplot(aes(x=Sepal.Width,y=Sepal.Length))+
geom_bar(stat="identity") + scale_fill_manual(values='lightblue')
这是结果,颜色没有改变:
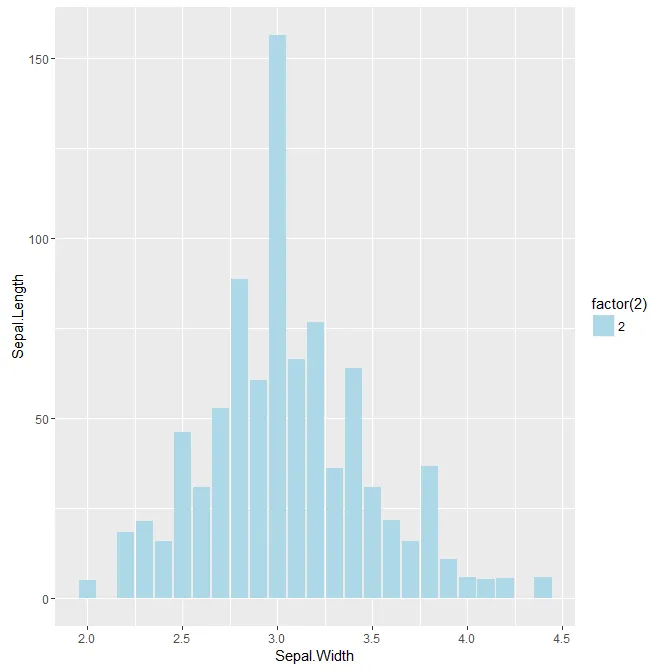
 现在,在美学内使用填充选项,它可以工作:
iris %>% ggplot(aes(x=Sepal.Width,y=Sepal.Length, fill=factor(2) ))+
geom_bar(stat="identity")+scale_fill_manual(values='lightblue')
有没有一种方法可以在不使用填充选项的情况下改变条形图的颜色,只使用scale_fill_manual?
aes中有一个fill美学时,scale_fill_manual才能起作用。但是如果你不想将数据列映射到填充美学中,为什么不在geom_bar中设置填充颜色呢:geom_bar(stat="identity", fill="lightblue")? - eipi10aes()函数是用来映射美学元素的,但你也可以使用普通的函数参数来设置它们。 - Axeman