我经常在终端上使用 Series 和 DataFrames。Series 的默认 __repr__ 返回一个缩减样本,其中包括一些头部和尾部值,但其余值则不显示。
是否存在内置的方法可以漂亮地打印整个 Series / DataFrame?理想情况下,它应该支持适当的对齐,列之间可能有边框,甚至可以为不同的列进行颜色编码。
我经常在终端上使用 Series 和 DataFrames。Series 的默认 __repr__ 返回一个缩减样本,其中包括一些头部和尾部值,但其余值则不显示。
是否存在内置的方法可以漂亮地打印整个 Series / DataFrame?理想情况下,它应该支持适当的对齐,列之间可能有边框,甚至可以为不同的列进行颜色编码。
您也可以使用option_context,并选择一个或多个选项:
with pd.option_context('display.max_rows', None, 'display.max_columns', None):  # more options can be specified also
    print(df)
这将自动将选项返回到它们以前的值。
如果您正在使用jupyter-notebook,使用display(df)而不是print(df)将使用jupyter丰富的显示逻辑 (像这样)。
display(df)而不是print(df)。 - tsvikas不需要黑客攻击设置。有一个简单的方法:
print(df.to_string())
如果这个功能经常使用,可以像这个函数一样制作一个。您甚至可以配置它在启动IPython时加载:https://ipython.org/ipython-doc/1/config/overview.html
def print_full(x):
    pd.set_option('display.max_rows', len(x))
    print(x)
    pd.reset_option('display.max_rows')
谈到着色,对我来说,过于复杂的颜色似乎会产生反作用,但我同意像Bootstrap的.table-striped这样的东西很不错。您可以随时创建问题以建议此功能。
在导入pandas后,除了使用上下文管理器外,还可以设置选项以显示整个数据框:
pd.set_option('display.max_columns', None)  # or 1000
pd.set_option('display.max_rows', None)  # or 1000
pd.set_option('display.max_colwidth', None)  # or 199
有关所有有用选项的完整列表,请参见:
pd.describe_option('display')
使用tabulate包:
pip install tabulate
并考虑以下使用示例:
import pandas as pd
from io import StringIO
from tabulate import tabulate

c = """Chromosome Start End
chr1 3 6
chr1 5 7
chr1 8 9"""

df = pd.read_table(StringIO(c), sep="\s+", header=0)

print(tabulate(df, headers='keys', tablefmt='psql'))

+----+--------------+---------+-------+
|    | Chromosome   |   Start |   End |
|----+--------------+---------+-------|
|  0 | chr1         |       3 |     6 |
|  1 | chr1         |       5 |     7 |
|  2 | chr1         |       8 |     9 |
+----+--------------+---------+-------+
pd.options.display这个答案是对之前的lucidyan的答案的变种。通过避免使用set_option,使代码更易读。
在导入pandas后,作为使用上下文管理器的替代方案,设置这样的选项以显示大型数据框:
def set_pandas_display_options() -> None:
    """Set pandas display options."""
    # Ref: https://dev59.com/oWIk5IYBdhLWcg3wl_PE#52432757/
    display = pd.options.display

    display.max_columns = 1000
    display.max_rows = 1000
    display.max_colwidth = 199
    display.width = 1000
    # display.precision = 2  # set as needed
    # display.float_format = lambda x: '{:,.2f}'.format(x)  # set as needed

set_pandas_display_options()
display(df)或者如果使用笔记本的话,只需使用df,否则使用print(df)。object数据类型的列,在应用显示精度之前,需要先将这些列转换为float数据类型。to_string
Pandas 0.25.3确实有DataFrame.to_string和Series.to_string方法,可以接受格式选项。to_markdown
如果你需要的是markdown输出,Pandas 1.0.0版本有DataFrame.to_markdown和Series.to_markdown方法。如果您正在使用IPython Notebook(Jupyter),您可以使用HTML。
from IPython.core.display import HTML
display(HTML(df.to_html()))
display(df)就可以。 - Chau Pham试一下这个
pd.set_option('display.height',1000)
pd.set_option('display.max_rows',500)
pd.set_option('display.max_columns',500)
pd.set_option('display.width',1000)
只需运行这个
    pd.set_option("display.max_rows", None, "display.max_columns", None)
    print(df)
只需这样做
输出
Column
0    row 0
1    row 1
2    row 2
3    row 3
4    row 4
5    row 5
6    row 6
7    row 7
8    row 8
9    row 9
10  row 10
11  row 11
12  row 12
13  row 13
14  row 14
15  row 15
16  row 16
17  row 17
18  row 18
19  row 19
20  row 20
21  row 21
22  row 22
23  row 23
24  row 24
25  row 25
26  row 26
27  row 27
28  row 28
29  row 29
30  row 30
31  row 31
32  row 32
33  row 33
34  row 34
35  row 35
36  row 36
37  row 37
38  row 38
39  row 39
40  row 40
41  row 41
42  row 42
43  row 43
44  row 44
45  row 45
46  row 46
47  row 47
48  row 48
49  row 49
50  row 50
51  row 51
52  row 52
53  row 53
54  row 54
55  row 55
56  row 56
57  row 57
58  row 58
59  row 59
60  row 60
61  row 61
62  row 62
63  row 63
64  row 64
65  row 65
66  row 66
67  row 67
68  row 68
69  row 69
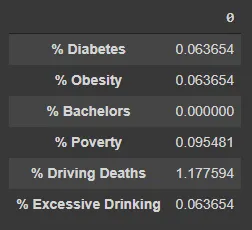
目前还没有人提出这个简单的纯文本解决方案:
from pprint import pprint

pprint(s.to_dict())
生成类似以下结果:
{'% Diabetes': 0.06365372374283895,
 '% Obesity': 0.06365372374283895,
 '% Bachelors': 0.0,
 '% Poverty': 0.09548058561425843,
 '% Driving Deaths': 1.1775938892425206,
 '% Excessive Drinking': 0.06365372374283895}
当使用Jupyter笔记本时,这是一个很好的解决方案。
注意: pd.Series() 没有 .to_html() 方法,因此必须将其转换为 pd.DataFrame()。
from IPython.display import display, HTML

display(HTML(s.to_frame().to_html()))
这将产生类似以下内容的结果: