我想在2行3列的布局中绘制5个数据框。这是我的代码:但第6个位置(第二行第三列)多了一个空图,我想去掉它。我想知道如何移除它,以便第一行有三个图,第二行有两个图。
import matplotlib.pyplot as plt
fig, axes = plt.subplots(nrows=2, ncols=3)

fig.set_figheight(8)
fig.set_figwidth(15)


df[2].plot(kind='bar',ax=axes[0,0]); axes[0,0].set_title('2')

df[4].plot(kind='bar',ax=axes[0,1]); axes[0,1].set_title('4')

df[6].plot(kind='bar',ax=axes[0,2]); axes[0,2].set_title('6')

df[8].plot(kind='bar',ax=axes[1,0]); axes[1,0].set_title('8')

df[10].plot(kind='bar',ax=axes[1,1]); axes[1,1].set_title('10')

plt.setp(axes, xticks=np.arange(len(observations)), xticklabels=map(str,observations),
        yticks=[0,1])

fig.tight_layout()
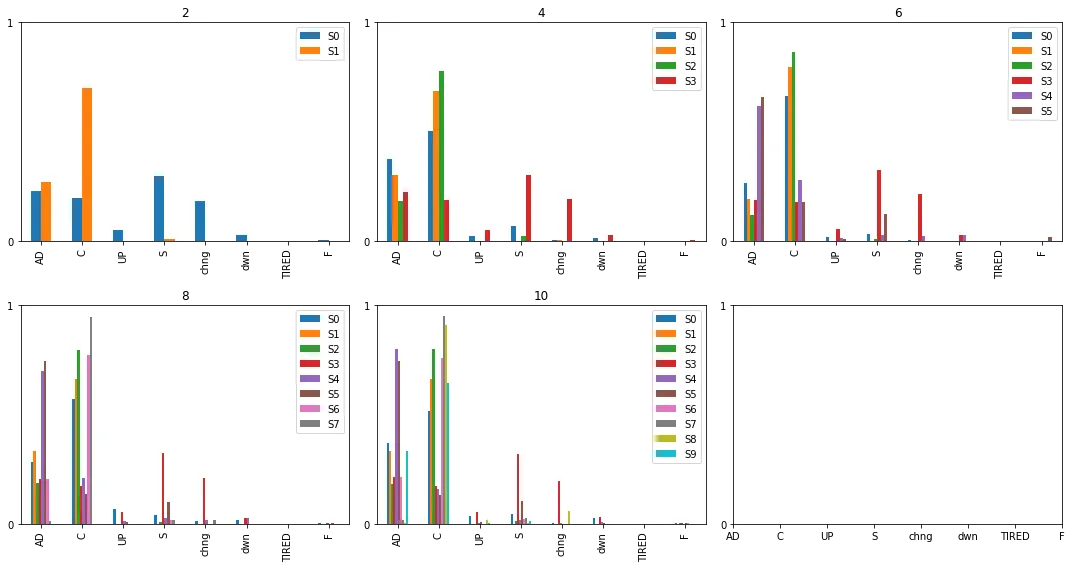
fig.add_axes()方法。它接受一个矩形的坐标(作为列表)并返回一个单个轴对象。这些坐标是相对于窗口大小的。我会在我的答案中放一个例子。 - Johannesadd_axes并不是生成子图的最好或推荐的方式。使用plt.subplots或者Gridspec是更好的选择,而delaxes或ax.axis("off")可以用来删除或隐藏子图。 - ImportanceOfBeingErnestplt.subplots已经足够了,并且这也是推荐的方式。但是在像这样的情况下或者如果您想要重叠的子图,我认为这是正确的方式。 - Johannes