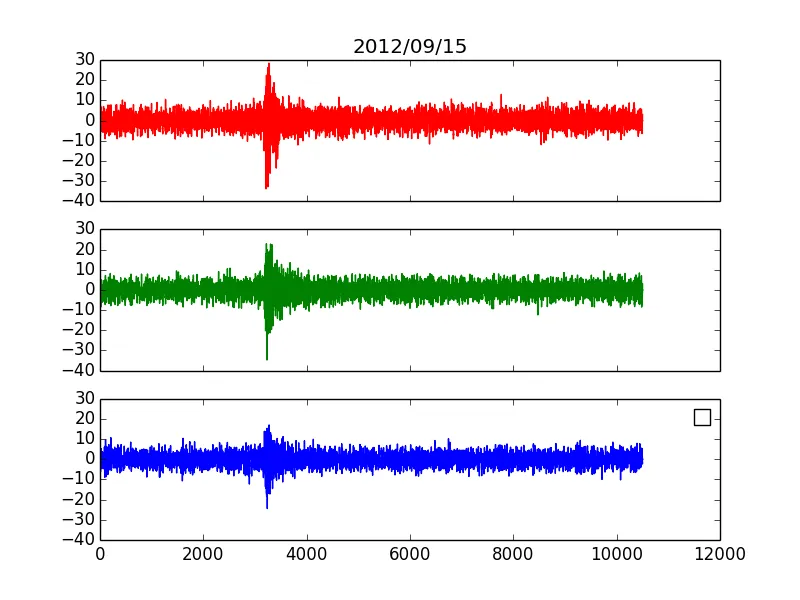
我希望能在下面每个小图中加入图例。我尝试使用plt.legend,但无效。
f, (ax1, ax2, ax3) = plt.subplots(3, sharex=True, sharey=True)
ax1.plot(xtr, color='r', label='Blue stars')
ax2.plot(ytr, color='g')
ax3.plot(ztr, color='b')
ax1.set_title('2012/09/15')
plt.legend([ax1, ax2, ax3],["HHZ 1", "HHN", "HHE"])
plt.show()
 根据atomh33ls的建议:
ax1.legend("HHZ 1",loc="upper right")
ax2.legend("HHN",loc="upper right")
ax3.legend("HHE",loc="upper right")
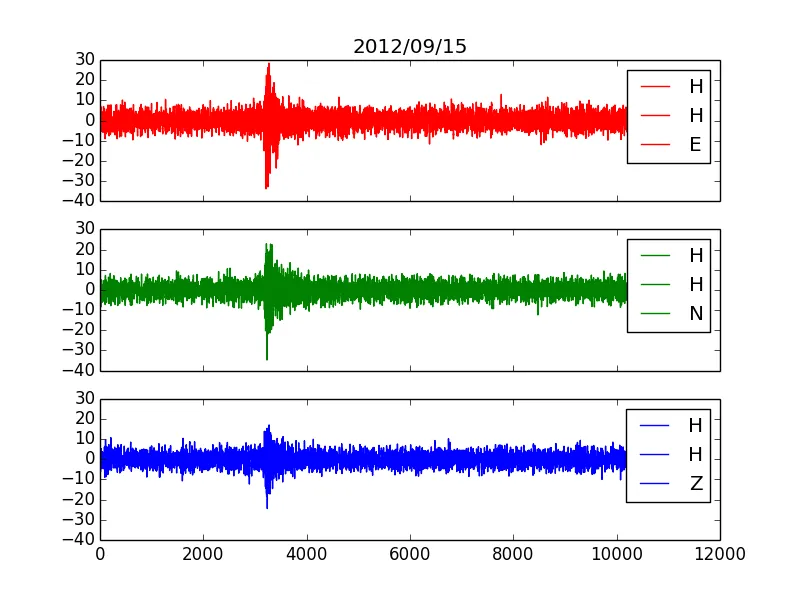
图例位置固定,但似乎存在字符串问题,因为每个字母都被放在新的一行中。
有人知道如何解决吗?

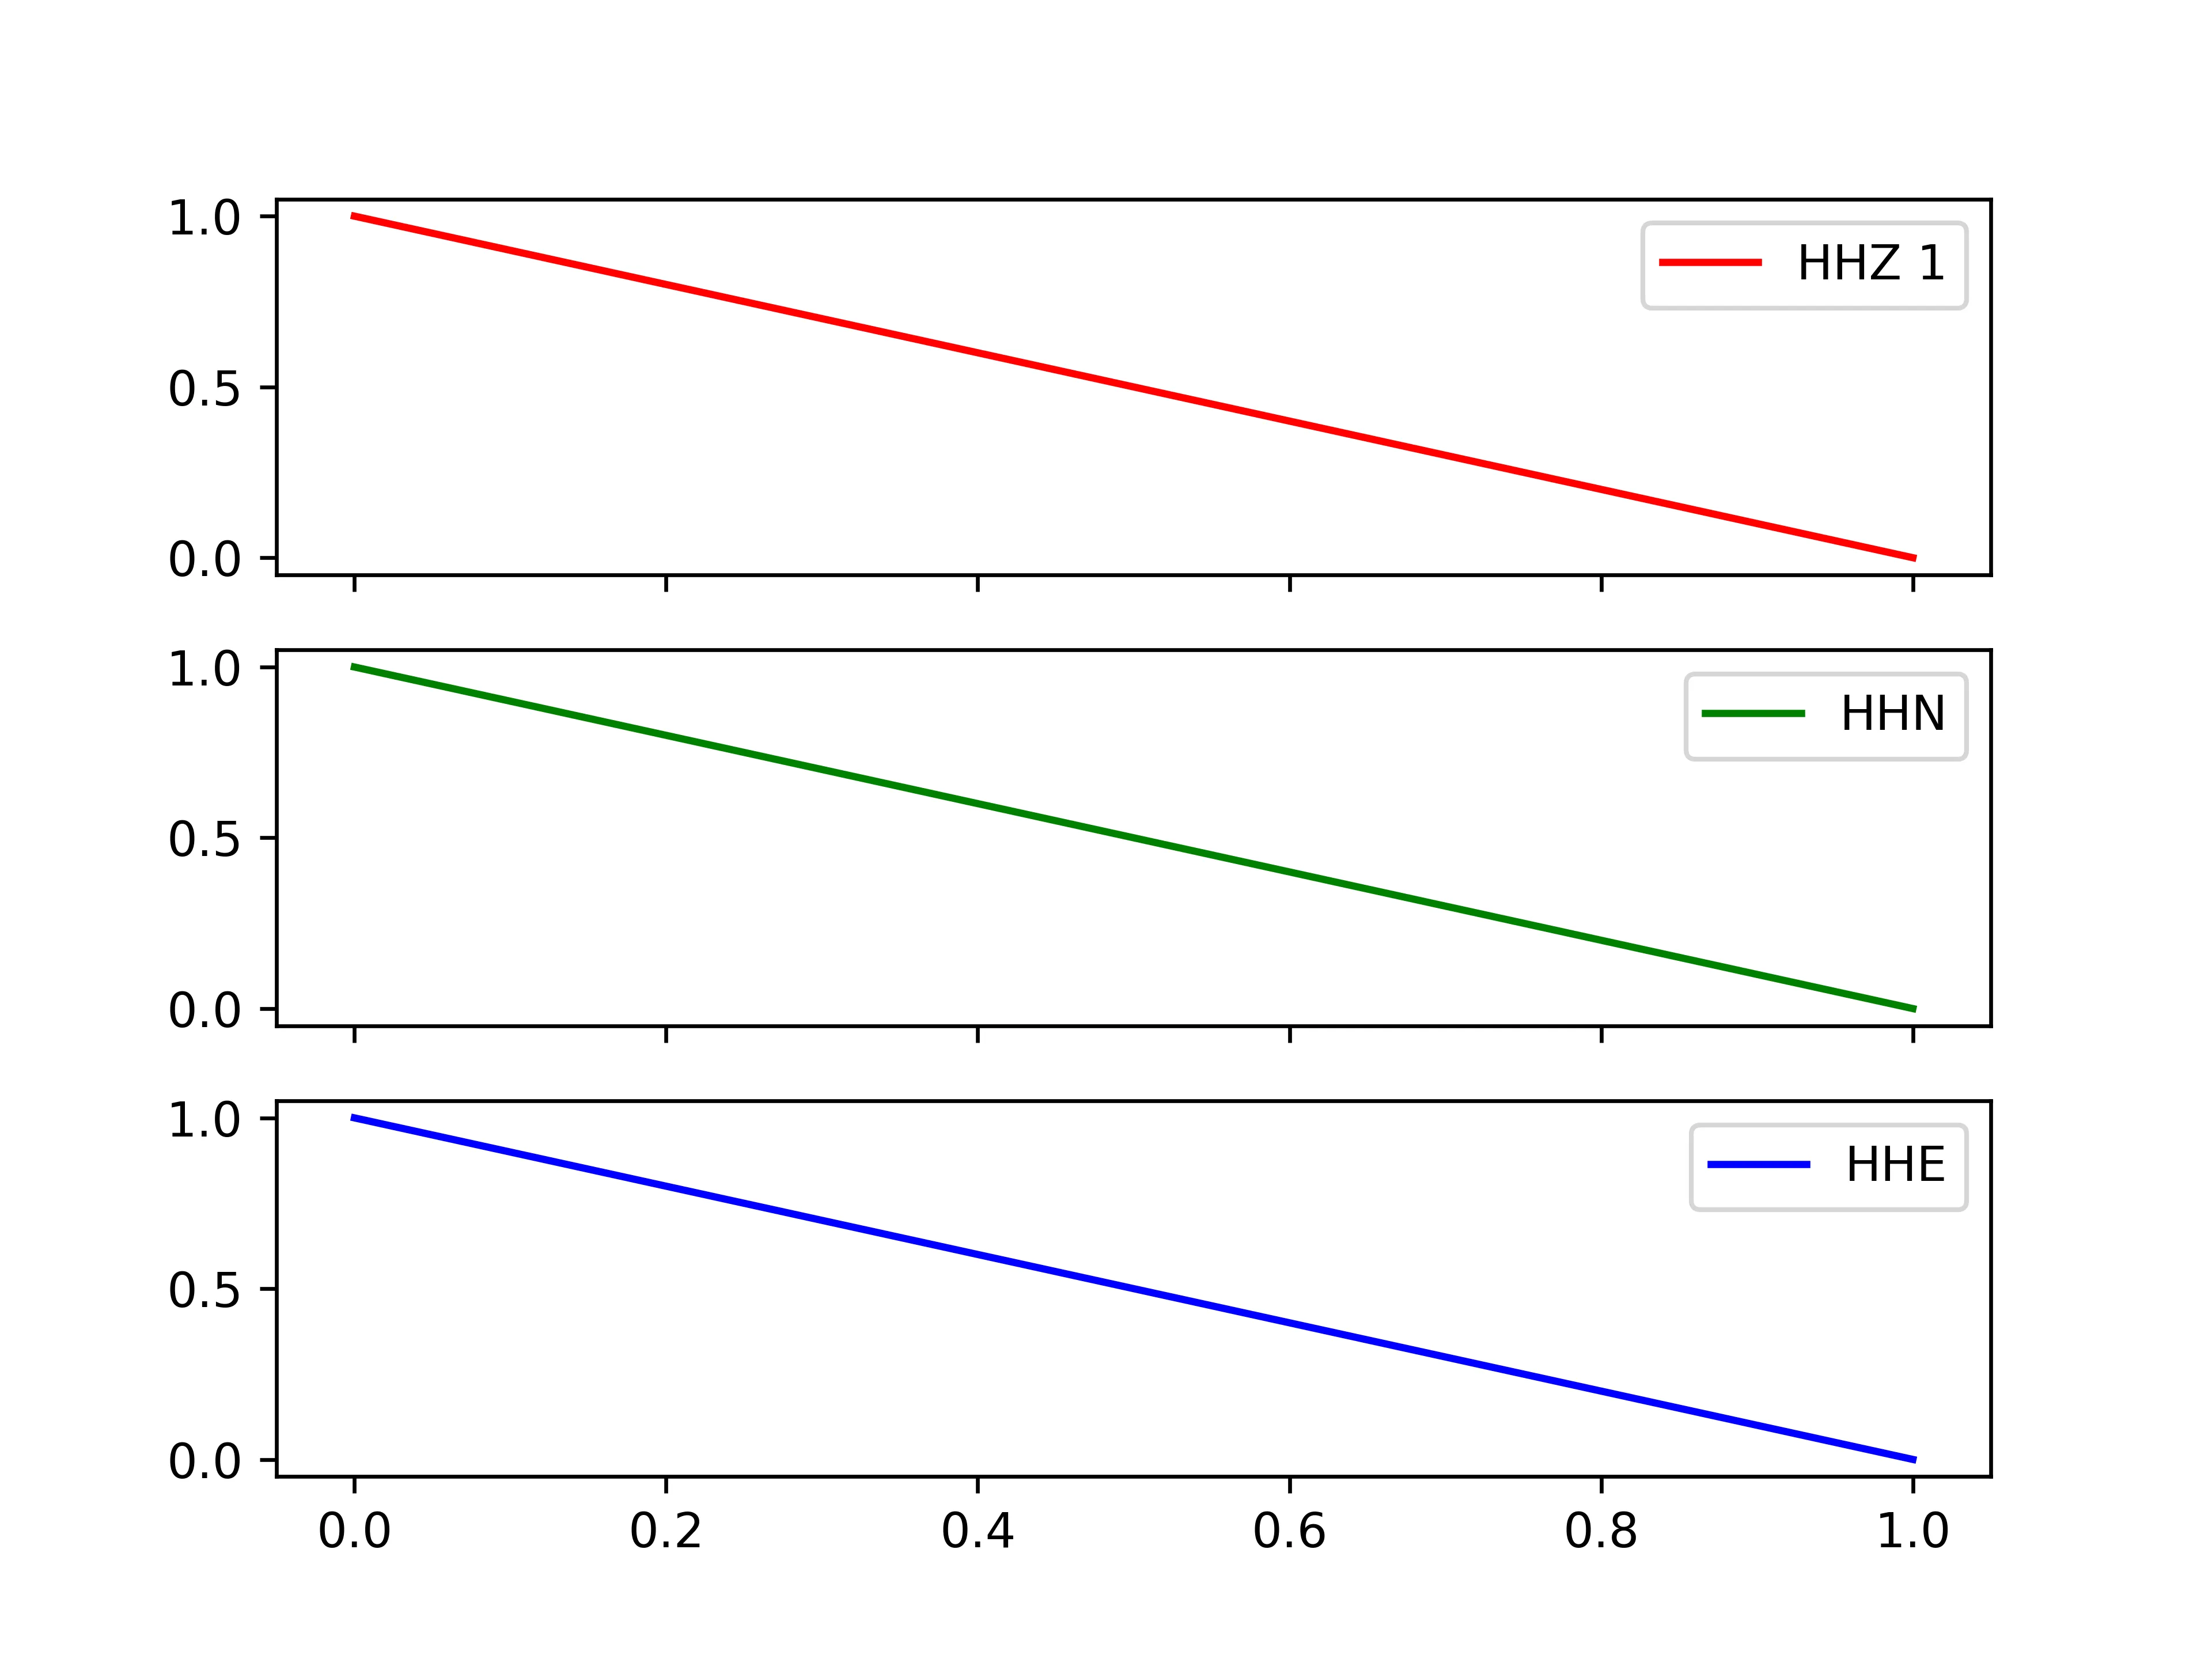
plot()命令中使用label关键字。 - user707650["HHZ"]或元组("HHZ",)中。 - Teepeemm