fig, ax = plt.subplots(3, 3, sharex='col', squeeze=False, figsize=(20, 10))
我想绘制7个子图,并使用上面的命令。但是它创建了9个图(包括2个空的)。我该如何确保只绘制7个图?
fig, ax = plt.subplots(3, 3, sharex='col', squeeze=False, figsize=(20, 10))
我想绘制7个子图,并使用上面的命令。但是它创建了9个图(包括2个空的)。我该如何确保只绘制7个图?
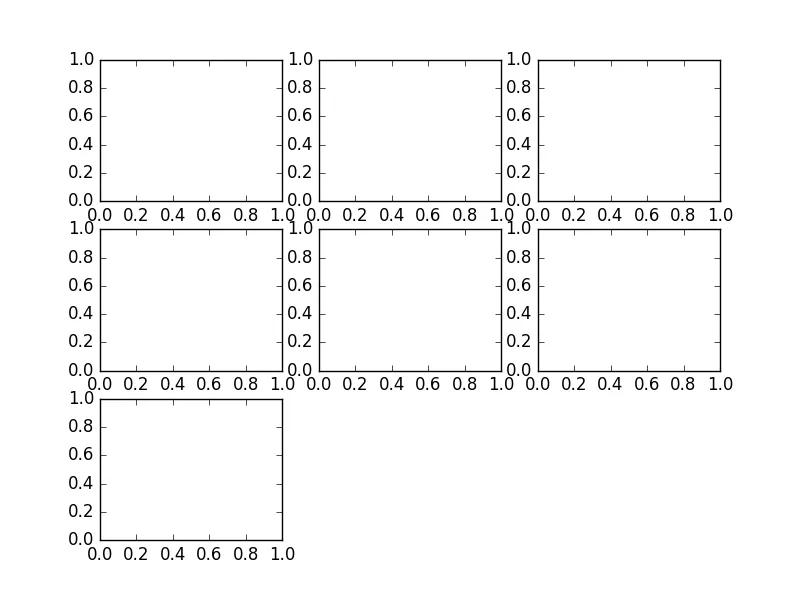
import matplotlib.pyplot as plt

fig, axs  = plt.subplots(3,3)
fig.delaxes(axs[-1, -1])
fig.delaxes(axs[-1, -2])

plt.show()