我正在尝试为现有的R包开发一个基于ggplot2的绘图函数。用户应该能够指定数据框(datfile),在图中放置垂直线的位置(alpha)以及用于通过分面创建子图的分组变量(group)。
以下是一些示例数据:
#Some hypothetical data
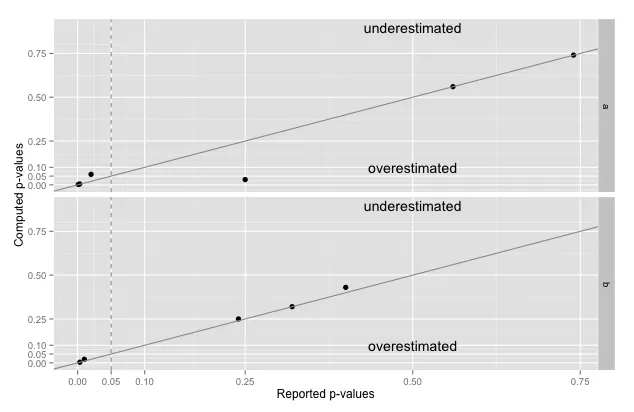
Computed=c(0.03, 0.25, 0.74, 0.02, 0.0023, 0.43, 0.56, 0.32, 0.005, 0.0032, 0.06)
Reported.P.Value=c(0.25, 0.24, 0.74, 0.01, 0.001, 0.40, 0.56, 0.32, 0.003, 0.0032, 0.02)
Journal=c("a", "b","a", "b","a", "b","a", "b","a", "b","a")
dat=data.frame(Computed, Reported.P.Value, Journal)
该函数如下所示:
plot1 <- function(datfile, alpha, group){

p <- ggplot(datfile, aes(y = Computed,x = Reported.P.Value))

p + geom_point(size=2.5)+
  geom_vline(xintercept=alpha, color="grey60",linetype="dashed")+
  geom_abline(intercept=0, slope=1, color="grey60")+
  annotate("text", x= 0.5, y = .10, label="overestimated")+
  annotate("text", x= 0.5, y = .90, label="underestimated")+
  scale_x_continuous(name="Reported p-values", breaks=c(0.00, 0.05, 0.10, 0.25, 0.50, 0.75, 1.0))+
  scale_y_continuous(name="Computed p-values", breaks=c(0.00, 0.05, 0.10, 0.25, 0.50, 0.75, 1.0))+
  facet_grid(group ~ .)
 }
如果我忽略函数,只是自己执行绘图代码(将数据帧中的适当向量替换进去),一切都能正常工作:
 但是如果尝试运行绘图函数本身...:
plot1(dat, 0.05, Journal)
我收到了这个错误信息:
Error in layout_base(data, rows, drop = drop) :
  At least one layer must contain all variables used for faceting
我的错误似乎与这个问题有关 (点击此处),接受答案的作者写道:
这是否意味着我不能将数据帧中的变量传递给函数中的分面选项?我的编程背景不是很好,如果我的函数用户无法指定分面变量,那将是一个真正的打击。非常感谢您的帮助!facet_grid需要特定名称,甚至不能是函数。
facet_grid需要一个公式,因此如果我们想使函数具有灵活性,我们需要通过编程方式构建公式。为了将正确的列传递到公式中,我们需要一个字符串,因为'Journal'不是默认环境中的独立对象。因此,我们将其作为一个字符串传递给公式,ggplot然后知道在向该函数提供的数据帧中查找该列。我不确定这是否是最优雅的方法,但它可以工作。 - eipi10facet_grid函数除了公式外还可以接受一个字符串。该字符串必须类似于“Journal ~ .”,因此这里唯一的简化就是不需要使用as.formula包装器。 - aosmith