我一直在使用这段代码的变体:
library(ggplot2)

Compare = matrix(c(
0,           0,           "Soil 1", "tF",
0.379268025, 5.555806214, "Soil 1", "tF",
0.961561989, 13.05580621, "Soil 1", "tF",
1.55418685,  20.55580621, "Soil 1", "tF",
0,           0,           "Soil 2", "tF",
0.104297312, 1.581249799, "Soil 2", "tF",
0.705818262, 6.081249799, "Soil 2", "tF",
1.447379092, 10.5812498,  "Soil 2", "tF",
0,           20,          "Soil 1", "tf",
0.379268025, 13.1603086,  "Soil 1", "tf",
0.961561989, 12.72354396, "Soil 1", "tf",
1.55418685,  12.60549558, "Soil 1", "tf",
0,           20,          "Soil 2", "tf",
0.104297312, 10.51383279, "Soil 2", "tf",
0.705818262, 6.433709727, "Soil 2", "tf",
1.447379092, 5.82398083,  "Soil 2", "tf",
0,           0,           "Soil 1", "zf",
0.379268025, 205.7706005, "Soil 1", "zf",
0.961561989, 483.5483783, "Soil 1", "zf",
1.55418685,  761.3261561, "Soil 1", "zf",
0,           0,           "Soil 2", "zf",
0.104297312, 23.25367352, "Soil 2", "zf",
0.705818262, 89.43014411, "Soil 2", "zf",
1.447379092, 155.6066147, "Soil 2", "zf"), nrow = 24, ncol = 4, byrow = TRUE)

plot = ggplot(as.data.frame(Compare),
aes(as.double(Compare[,1]), as.double(Compare[,2]), color = Compare[,3])) +
    geom_point() + facet_grid(Compare[,4] ~ .)
plot
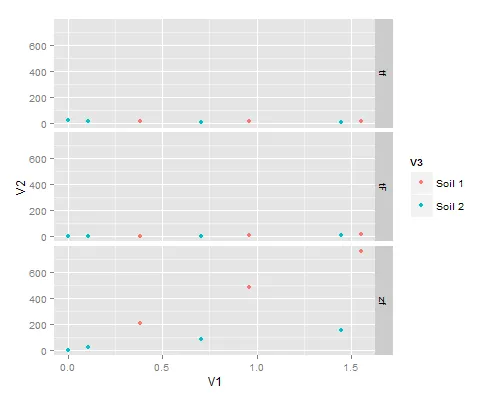
我的问题与代码中的
facet_grid()有关。如果我将其注释或删除,代码就能正常运行,所以我知道我的问题与它有关。我想要实现的是一个垂直排列的三个面板,用Compare[,1]作为x轴,Compare[,2]作为y轴,在 Compare[,3]的基础上进行着色(在每个面板上为两种土壤类型生成一组点),并根据Compare[,4]生成三个面板。当我在代码中包含
facet_grid()时出现的错误是:Error in layout_base(data, rows, drop = drop) :
At least one layer must contain all variables used for facetting
我觉得我的错误可能与将double和dataframe强制转换为处理矩阵的初始形式有关,但我不确定需要改变什么。