Pandas的
to_html函数会输出一个大字符串,其中包含HTML表格标记。classes参数是一个方便的处理器,可以给
<table>添加
class属性,在
之前创建的CSS文档中引用它。因此,将
to_html纳入引用外部CSS的更广泛的HTML文档构建中。
有趣的是,
to_html会添加双重类
<table class="dataframe mystyle">,这些类可以在CSS中单独引用,例如:
.dataframe {...} .mystyle{...}或者同时使用
.dataframe.mystyle {...}。下面展示了使用随机数据的示例。
Dataimport pandas as pd
import numpy as np
pd.set_option('display.width', 1000)
pd.set_option('colheader_justify', 'center')
np.random.seed(6182018)
demo_df = pd.DataFrame({'date': np.random.choice(pd.date_range('2018-01-01', '2018-06-18', freq='D'), 50),
'analysis_tool': np.random.choice(['pandas', 'r', 'julia', 'sas', 'stata', 'spss'],50),
'database': np.random.choice(['postgres', 'mysql', 'sqlite', 'oracle', 'sql server', 'db2'],50),
'os': np.random.choice(['windows 10', 'ubuntu', 'mac os', 'android', 'ios', 'windows 7', 'debian'],50),
'num1': np.random.randn(50)*100,
'num2': np.random.uniform(0,1,50),
'num3': np.random.randint(100, size=50),
'bool': np.random.choice([True, False], 50)
},
columns=['date', 'analysis_tool', 'num1', 'database', 'num2', 'os', 'num3', 'bool']
)
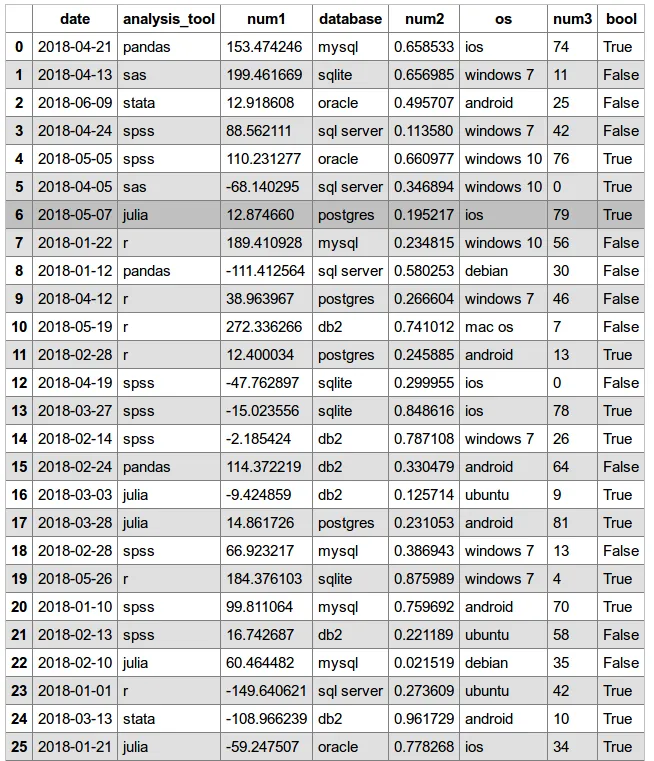
print(demo_df.head(10))
CSS (保存为df_style.css)
.mystyle {
font-size: 11pt;
font-family: Arial;
border-collapse: collapse;
border: 1px solid silver;
}
.mystyle td, th {
padding: 5px;
}
.mystyle tr:nth-child(even) {
background: #E0E0E0;
}
.mystyle tr:hover {
background: silver;
cursor: pointer;
}
Pandas
pd.set_option('colheader_justify', 'center')   # FOR TABLE <th>

html_string = '''
<html>
  <head><title>HTML Pandas Dataframe with CSS</title></head>
  <link rel="stylesheet" type="text/css" href="df_style.css"/>
  <body>
    {table}
  </body>
</html>.
'''

# OUTPUT AN HTML FILE
with open('myhtml.html', 'w') as f:
    f.write(html_string.format(table=demo_df.to_html(classes='mystyle')))
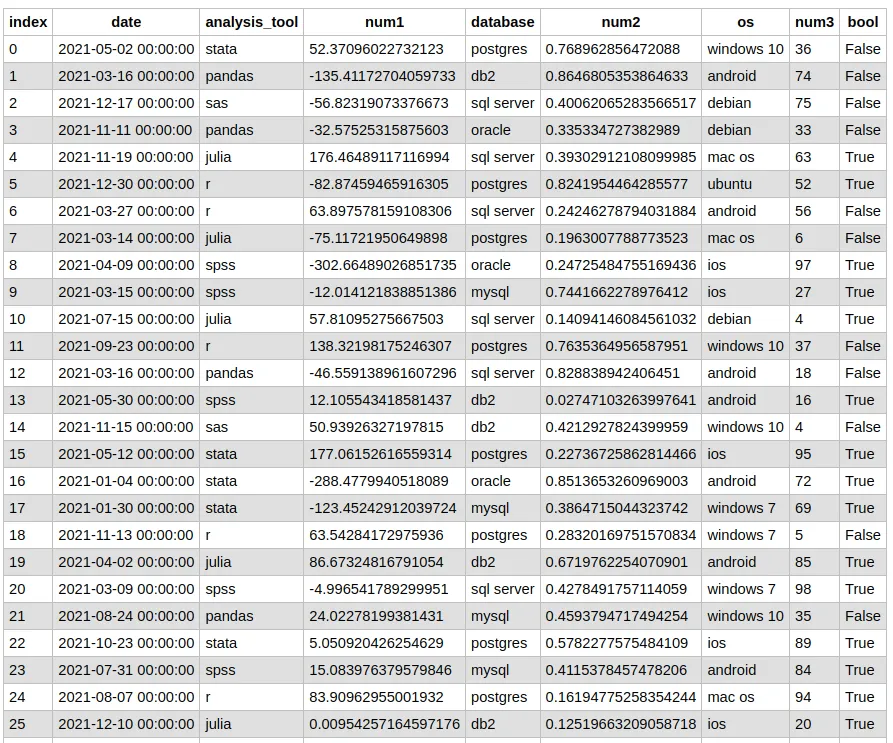
输出
HTML (引用了df_style.css,在同一目录下;表格中的class参数参见)
<html>
  <head><title>HTML Pandas Dataframe with CSS</title></head>
  <link rel="stylesheet" type="text/css" href="df_style.css"/>
  <body>
    <table border="1" class="dataframe mystyle">
  <thead>
    <tr style="text-align: center;">
      <th></th>
      <th>date</th>
      <th>analysis_tool</th>
      <th>num1</th>
      <th>database</th>
      <th>num2</th>
      <th>os</th>
      <th>num3</th>
      <th>bool</th>
    </tr>
  </thead>
  <tbody>
    <tr>
      <th>0</th>
      <td>2018-04-21</td>
      <td>pandas</td>
      <td>153.474246</td>
      <td>mysql</td>
      <td>0.658533</td>
      <td>ios</td>
      <td>74</td>
      <td>True</td>
    </tr>
    <tr>
      <th>1</th>
      <td>2018-04-13</td>
      <td>sas</td>
      <td>199.461669</td>
      <td>sqlite</td>
      <td>0.656985</td>
      <td>windows 7</td>
      <td>11</td>
      <td>False</td>
    </tr>
    <tr>
      <th>2</th>
      <td>2018-06-09</td>
      <td>stata</td>
      <td>12.918608</td>
      <td>oracle</td>
      <td>0.495707</td>
      <td>android</td>
      <td>25</td>
      <td>False</td>
    </tr>
    <tr>
      <th>3</th>
      <td>2018-04-24</td>
      <td>spss</td>
      <td>88.562111</td>
      <td>sql server</td>
      <td>0.113580</td>
      <td>windows 7</td>
      <td>42</td>
      <td>False</td>
    </tr>
    <tr>
      <th>4</th>
      <td>2018-05-05</td>
      <td>spss</td>
      <td>110.231277</td>
      <td>oracle</td>
      <td>0.660977</td>
      <td>windows 10</td>
      <td>76</td>
      <td>True</td>
    </tr>
    ...
  </tbody>
</table>
  </body>
</html>
"<style type='text/css'>" + myStyles + "</style>"并将其附加到df.to_html()给出的字符串中。 - user8745435