如何使表示二叉树的点图更对称?

7

在尝试使用Graphviz创建二叉树的图表时,我遇到了一个问题。很明显,在树的高度足够高且nodesep足够大的情况下,结果图表往往不对称。这里是一个点源代码示例:

digraph G {
    nodesep=0.8;
    ranksep=0.5;

    {node[style=invis,label=""]; cx_30;
    }

    {rank=same; 20; 45; cx_30}
    {rank=same; 10; 25;}
    {rank=same; 40; 50}

    30 -> 20;
    30 -> 45;
    20 -> 10;
    20 -> 25;

    45 -> 40;
    45 -> 50;

    {edge[style=invis];
                        //Distantiate nodes
                        30 -> cx_30;
                            20 -> cx_30 -> 45;

                        //Force ordering between childs
                        10:e -> 25:w;
                        40:e -> 50:w;
    } 
} 

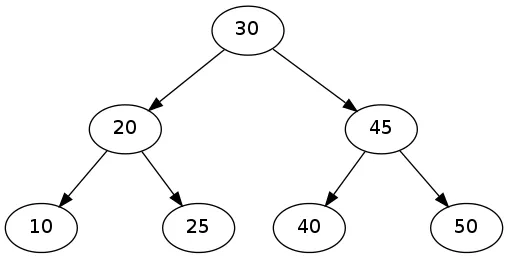
使用相应输出命令(使用dot -Tpng file.dot > file.png编译)可以得到以下输出结果:

dot tree result

从图中可以看出,45未被放置在4050的中间位置。您可以在4050之间插入不可见节点以矫正此情况,但导致的间距会太宽。

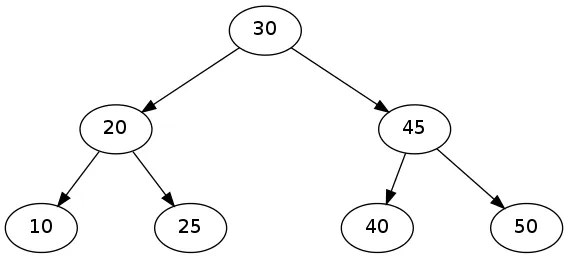
您是否做错了什么?有没有办法纠正这种情况?


1
请查看这里的建议,其中一些可能会有用 - https://dev59.com/iGgv5IYBdhLWcg3wBMSg - Tom Ron
谢谢,我不知道为什么在搜索时没有找到它。我现在正在尝试看看是否可以用这种方式解决我的问题。 - gcali
1个回答

6

虽然直接的方法对我没用,但我要传递Tom Ron的建议,关注这个答案有关二叉树的;提供的脚本对我不起作用,但是链接到的FAQ条目帮助我解决了问题;我不想添加一个不可见的节点来调整间距,但为不可见的节点指定正确的width属性,并相应地缩放nodesep就可以正常工作。

这是一个已纠正的源代码:

digraph G {
    nodesep=0.4; //was 0.8
    ranksep=0.5;

    {node[style=invis,label=""]; cx_30;
    }
    {node[style=invis, label="", width=.1]; ocx_45; ocx_20;
    }

    {rank=same; 20; 45; cx_30}
    {rank=same; 10; 25; ocx_20}
    {rank=same; 40; 50; ocx_45}

    30 -> 20;
    30 -> 45;
    20 -> 10;
    20 -> 25;

    45 -> 40;
    45 -> 50;

    {edge[style=invis];
                        //Distantiate nodes
                        30 -> cx_30;
                            20 -> cx_30 -> 45;

                        //Force ordering between children
                        45 -> ocx_45;
                            40 -> ocx_45 -> 50;
                        20 -> ocx_20;
                            10 -> ocx_20 -> 25;
    } 
} 

附带相应的输出 dot tree output


网页内容由stack overflow 提供, 点击上面的
可以查看英文原文,
原文链接