r-从多边形输入生成点网格

3

我正在编写一个脚本,它可以获取在谷歌地球创建的输入文件KML,并在多边形内绘制坐标点网格。

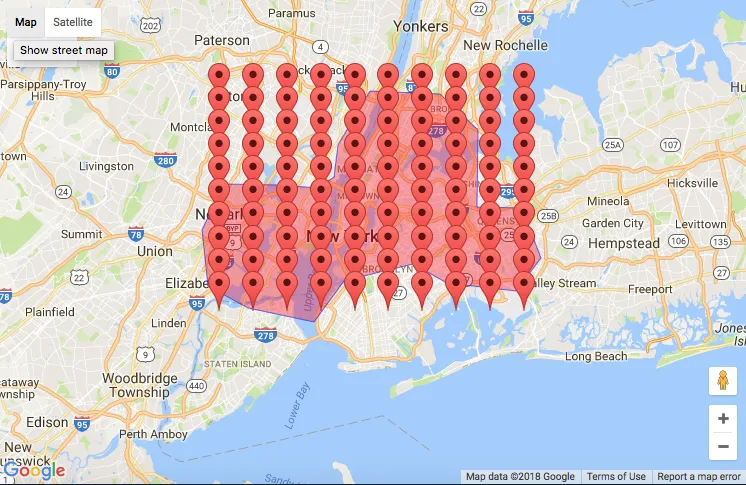
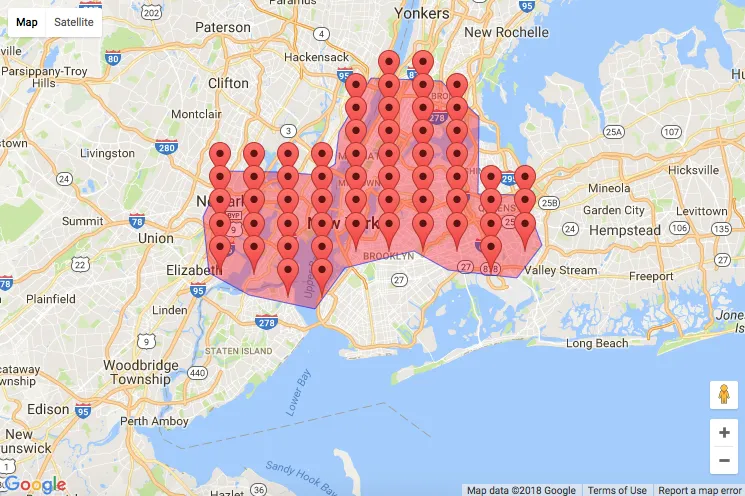
到目前为止,我已经有了多边形输入和一个围绕多边形的点网格,但我希望只有多边形内的点。

我尝试使用over()函数来实现这一点,但它没有起作用。是否有其他建议?

您可以在此处下载我的测试KML文件HERE

library(rgdal)
library(sp)
library(maptools)

# ogrInfo() to find layer name... not as labelled in Google Earth?!
my.poly = readOGR(ds = "PolyNYC.kml", layer = "PolyNYC") 
proj4string(my.poly) <- "+proj=longlat +datum=WGS84 +no_defs"

# Creating grid of points
grdpts <- makegrid(my.poly)

# Converting from df to spdf
coords = cbind(grdpts$x1, grdpts$x2)
sp = SpatialPoints(coords)
spdf = SpatialPointsDataFrame(coords, grdpts, proj4string = CRS(proj4string(my.poly)))

# Using over() to select only those points in the polygon
inPoly = over(spdf, my.poly)
# This is not working

# Plotting the polygon with the points overlaid.
plot(my.poly)
points(spdf, pch = 3, col = "red")

#kmlPoints(obj = spdf, kmlfile = "BBoxFromPoly.kml", kmlname = "Testing123")
1个回答

6
我将展示一种解决方案,使用library(sf),它是library(sp)的后继者。

加载数据

library(sf)

## read the kml
my.poly <- sf::st_read("~/Downloads/PolyNYC.kml")

## create a grid of points
grdpts <- sf::st_make_grid(my.poly, what = "centers")

## convert it to an `sf` object, as opposed to an `sfc`
my.points <- sf::st_sf(grdpts)

查看数据

为了查看地图上的对象,我使用了我的 Googleway 包,将其绘制在 Google 地图上(因此您需要一个 API 密钥),但您可以使用 leaflet 或任何您想要的地图。

library(googleway)

set_key("your_api_key_here")

google_map() %>%
  add_polygons(my.poly) %>%
  add_markers(my.points)

多边形内点

您可以使用函数sf::st_join()来连接几何图形。

enter image description here

pointsInside <- sf::st_join(x = my.points, y = my.poly, left = FALSE)

# Simple feature collection with 59 features and 2 fields
# geometry type:  POINT
# dimension:      XY
# bbox:           xmin: -74.1754 ymin: 40.63513 xmax: -73.75675 ymax: 40.8514
# epsg (SRID):    4326
# proj4string:    +proj=longlat +datum=WGS84 +no_defs
# First 10 features:
#   Name Description                   geometry
# 1  TestLayerNYC             POINT (-74.08237 40.63513)
# 2  TestLayerNYC             POINT (-74.03585 40.63513)
# 3  TestLayerNYC              POINT (-74.1754 40.65916)
# 4  TestLayerNYC             POINT (-74.12889 40.65916)
# 5  TestLayerNYC             POINT (-74.08237 40.65916)
# 6  TestLayerNYC             POINT (-74.03585 40.65916)
# 7  TestLayerNYC             POINT (-73.80326 40.65916)
# 8  TestLayerNYC              POINT (-74.1754 40.68319)
# 9  TestLayerNYC             POINT (-74.12889 40.68319)
# 10 TestLayerNYC             POINT (-74.08237 40.68319)

在这里,pointsInside是所有在多边形内部的点。

查看结果

google_map() %>%
  add_polygons(my.poly) %>%
  add_markers(pointsInside)

enter image description here


这很完美,谢谢!您如何指定单元格大小为20公里网格? - Heliornis
@Heliornis - 我认为你需要查看cellsize参数;但我不完全确定你需要的确切参数。 - SymbolixAU

网页内容由stack overflow 提供, 点击上面的
可以查看英文原文,
原文链接