有没有一种方法可以使用R在多边形内生成定期间隔(例如500米)的点?我一直在尝试使用sp包,但似乎无法定义一组相互之间距离为一定距离的点。我的目的是生成这些点,然后将它们的纬度/经度坐标提取到一个新的数据框中。任何帮助都将不胜感激!谢谢
2个回答
2
非常简单,几乎可以直接使用。
由于原始问题没有分享数据,所以请系好安全带,把座位竖起来,让我们一起 飞往巴黎。在那里,我们将使用geosphere函数,并借助它的帮助,将巴黎的形状分成每个纵横坐标间隔为500米的经/纬度坐标。
注:OP指原始问题的提出者,geosphere是一个R语言包中用于计算球面上距离和区域的函数库。
# Load necessary libraries.
library(raster)
library(geosphere)
library(tidyverse)
library(sp)
# This is an adapted version of geosphere's destPoint() function that works with
# changing d (distance).
destPoint_v <- function (x, y, b, d, a = 6378137, f = 1/298.257223563, ...)
{
r <- list(...)$r
if (!is.null(r)) {
return(.old_destPoint(x, y, b, d, r = r))
}
b <- as.vector(b)
d <- as.vector(d)
x <- as.vector(x)
y <- as.vector(y)
p <- cbind(x, y, b, d)
r <- .Call("_geodesic", as.double(p[, 1]), as.double(p[, 2]),
as.double(p[, 3]), as.double(p[, 4]),
as.double(a), as.double(f),
PACKAGE = "geosphere")
r <- matrix(r, ncol = 3, byrow = TRUE)
colnames(r) <- c("lon", "lat", "finalbearing")
return(r[, 1:2, drop = FALSE])
}
# Data can be downloaded from
# http://osm13.openstreetmap.fr/~cquest/openfla/export/communes-20190101-shp.zip
# or
# https://www.data.gouv.fr/en/datasets/decoupage-administratif-communal-francais-issu-d-openstreetmap/
# ("Export simple de janvier 2019 (225Mo)")
# Load shapefile.
# shp <- raster::shapefile("Dropbox/work/crema/communes-20190101-shp/communes-20190101.shp")
# Extract Paris.
paris <- shp[shp$nom == "Paris", ]
# Set distance of points in meters.
dist <- 500
# Extract bounding box from Paris' SpatialPolygonDataFrame.
bbox <- raster::extent(paris)
# Calculate number of points on the vertical axis.
ny <- ceiling(geosphere::distGeo(p1 = c(bbox@xmin, bbox@ymin),
p2 = c(bbox@xmin, bbox@ymax)) / dist)
# Calculate maximum number of points on the horizontal axis.
# This needs to be calculated for the lowermost and uppermost horizontal lines
# as the distance between latitudinal lines varies when the longitude changes.
nx <- ceiling(max(geosphere::distGeo(p1 = c(bbox@xmin, bbox@ymin),
p2 = c(bbox@xmax, bbox@ymin)) / dist,
geosphere::distGeo(p1 = c(bbox@xmin, bbox@ymax),
p2 = c(bbox@xmax, bbox@ymax)) / dist))
# Create result data frame with number of points on vertical axis.
df <- data.frame(ny = 1:ny)
# Calculate coordinates along the vertical axis.
pts <- geosphere::destPoint(p = c(bbox@xmin, bbox@ymin),
b = 0, d = dist * (1:ny - 1))
df$x <- pts[, 1]
df$y <- pts[, 2]
# Add points on horizontal axis.
df <- tidyr::crossing(nx = 1:nx, df)
# Calculate coordinates.
pts <- destPoint_v(df$x, df$y, b = 90, 500 * (df$nx - 1))
# Turn coordinates into SpatialPoints.
pts <- SpatialPoints(cbind(pts[, 1], pts[, 2]), proj4string = CRS(proj4string(paris)))
# Cut to boundaries of Paris.
result <- raster::intersect(pts, paris)
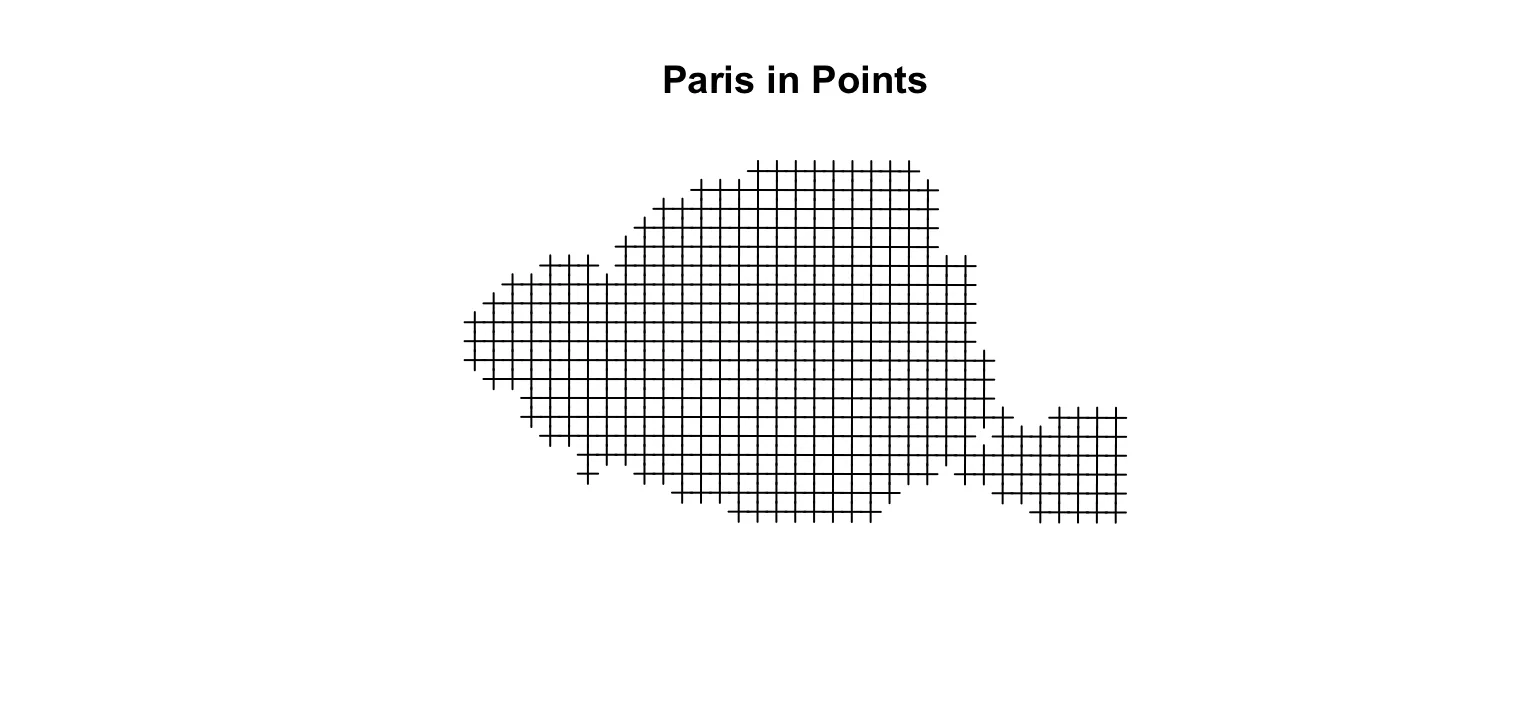
# Plot result.
plot(result)
title("Paris in Points")
- Roman
1
geosphere函数是向量化的。您可以直接使用
destPoint,而不必创建destPoint_v,例如geosphere::pts <- destPoint(df[, c("x", "y")], b = 90, 500 * (df$nx - 1))。 - Robert Hijmans0
这里有一个方法,假设您有一个经纬度多边形,首先将其转换为平面坐标参考系统(不像Roman的解决方案与destPoint一样巧妙)。
包和示例数据。
包和示例数据。
library(raster)
library(rgdal)
p <- shapefile(system.file("external/lux.shp", package="raster"))[1,]
转换为平面坐标参考系统(选择与您的数据匹配的一个!)
putm <- spTransform(p, "+proj=utm +zone=32 +datum=WGS84")
创建一个500米分辨率的栅格,将多边形转换为栅格并转换为点
r <- raster(putm, res=500)
r <- rasterize(putm, r)
pts <- rasterToPoints(r, spatial=TRUE)
将点转换为经纬度并绘制结果
pts_lonlat <- spTransform(pts, "+proj=longlat +datum=WGS84")
result <- coordinates(pts_lonlat)

plot(p)
points(result, pch="+", cex=.5)
(看起来像一只大象)
- Robert Hijmans
网页内容由stack overflow 提供, 点击上面的可以查看英文原文,
原文链接
原文链接
sp包中的SpatialGrid或GridTopology,再结合over()函数。 - rcspoint.in.polygon来拒绝数组中不需要的元素? - Carl Witthoftcbind(rep(seq(0,5000,500),each=10),rep(seq(0,5000,500),times=10))生成一个矩阵,其中每行都包含一个坐标对。 - Carl Witthoft