我正在制作一张柱状图,如您所见的图片。问题在于XAxis上的条形名称与条形本身不匹配。在fxml中,刻度标签旋转设置为-45度。如何将它们精确地移动到条形下面?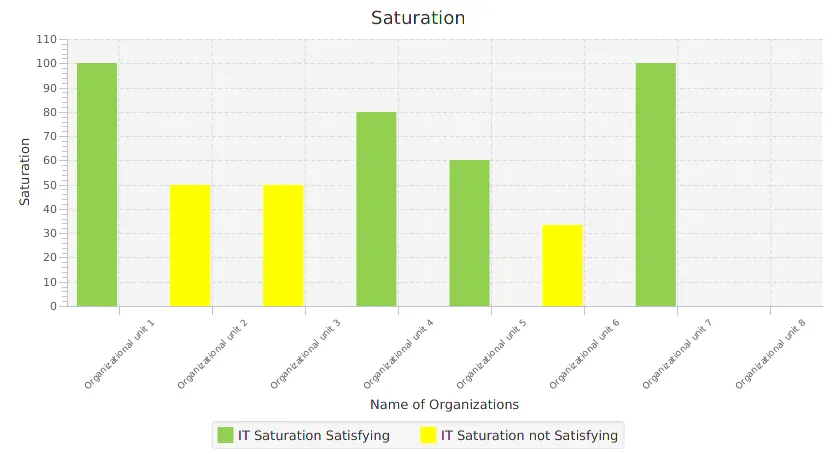
public class MostComputerizedController {
@FXML
private BarChart<String, Number> barChart;
@FXML
private CategoryAxis orgNameAxis;
@FXML
private NumberAxis yAxis;
@FXML
private Label itsfField;

private ObservableList<String> orgNames = FXCollections
        .observableArrayList();
private DataConstructor dc = new DataConstructor();
private int numberOfOrganizations;
private List<Double> sumOfOrgsITSF = new ArrayList<Double>();

/**
 * sets the name of x axis, with the name of organizations
 */
@FXML
private void initialize() {
    dc.findSortedAssignedOrg();
    dc.orgFuncFuncType();
    orgNames.addAll(dc.getOrgFuncFunctype().keySet());
    orgNameAxis.setCategories(orgNames);

    orgNameAxis.setLabel("Name of Organizations");
    orgNameAxis.tickLabelFontProperty().set(Font.font(9));
    yAxis.setLabel("Saturation");
    numberOfOrganizations = dc.getSortedAssignedOrg().size();

}

/**
 * sets organization and their saturation
 */
public void setOrgData() {
    XYChart.Series<String, Number> seriesGreen = new XYChart.Series<>();
    XYChart.Series<String, Number> seriesYellow = new XYChart.Series<>();
    seriesGreen.setName("IT Saturation Satisfying");
    seriesYellow.setName("IT Saturation not Satisfying");
    for (Entry<String, List<Double>> entry : dc.getOrgFuncFunctype()
            .entrySet()) {
        sumOfOrgsITSF.add(entry.getValue().get(0));
        if (entry.getValue().get(0) > 50) {
            seriesGreen.getData().add(
                    new XYChart.Data<String, Number>(entry.getKey(), entry
                            .getValue().get(0)));
        } else if ((entry.getValue().get(0) <= 50)) {
            seriesYellow.getData().add(
                    new XYChart.Data<String, Number>(entry.getKey(), entry
                            .getValue().get(0)));
        }

    }

    double value = sumOfOrgsITSF.stream().mapToDouble(Double::doubleValue)
            .sum()
            / numberOfOrganizations;
    itsfField.setText(String.format("%.0f", value) + "%");
    barChart.setBarGap(1);
    barChart.setCategoryGap(10);
    barChart.getData().addAll(seriesGreen, seriesYellow);
}