我有一些与实验处理相关的数据,这些数据是负值。我想把 x 轴放在柱状图上方,并且让标签位于传统柱状图中心位置。
我查找了很多地方,但找不到任何东西可以用单词命名轴标签,只能设置刻度和数字。
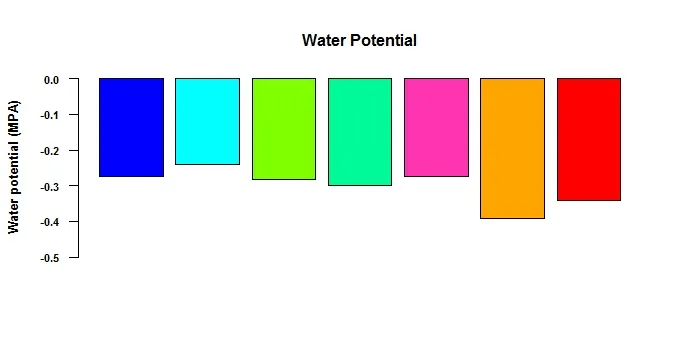
以下是数据:- “wp_means”
>         12         15          3          6          9    Control
-0.3000000 -0.2416667 -0.3416667 -0.3916667 -0.2750000 -0.2750000
        DL
-0.2833333
这是我的绘制条形图的代码。我可以将x轴从通常的位置省略,但似乎无法将其与标签等放在我想要的位置的顶部。
cols<-c("blue1", "cyan","chartreuse","mediumspringgreen","maroon1","orange","red")
wp<-data.frame(a=c(wp_means),b=c(12,15,3,6,9,"Control","DL"))
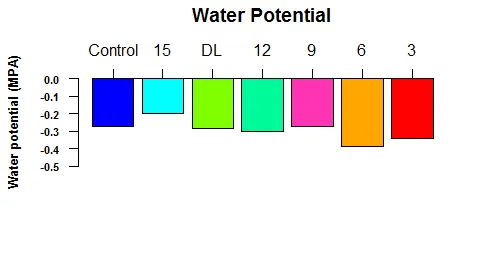
wp$c=factor(wp$b, levels = c("Control",15,"DL",12,9,6,3))
wp <- wp[order(wp$c), ]
barplot(height=wp$a,names.arg=wp$c,col=cols,main="Water Potential",las=1,xaxt="n",
ylab = "Water potential
(MPA)",pch=21,bg="black",cex=0.7,cex.lab=0.8,font.lab=2,
cex.axis=0.7,font.axis=2,cex.main=1,ylim=c(-0.5,0),xaxt="n")
这里是需要翻译的内容:
以下是主要内容:我希望上部 X 轴上的标签按照 "levels = c("Control"....)" 中的顺序出现。同时,我也想设置一个标签标题,就像使用 xlab="some name" 一样,但不影响我的图表标题。
谢谢