我有一个用于窗口的以下控制器:
package window;

import javafx.event.ActionEvent;
import javafx.fxml.FXML;
import javafx.scene.chart.BarChart;
import javafx.scene.chart.CategoryAxis;
import javafx.scene.chart.NumberAxis;
import javafx.scene.chart.XYChart;

import java.util.Map;
import java.util.SortedMap;

public class StatisticsController {

    @FXML
    private BarChart<?, ?> barChartHistogram;

    private SortedMap<String, Integer> _points;

    @FXML
    private CategoryAxis xAxis;
    @FXML
    private NumberAxis yAxis;

    public void onLoad(SortedMap<String, Integer> points) {
        xAxis.setLabel("Numer indeksu");
        yAxis.setLabel("Ilość punktów");
        //barChartHistogram.setBarGap(0);
        XYChart.Series series1 = new XYChart.Series();
        int a = 10;
        series1.getData().add(new XYChart.Data("Tom", 10));
        series1.getData().add(new XYChart.Data("Andrew", 7));
        series1.getData().add(new XYChart.Data("Patrick", 5));


        /*for (Map.Entry<String, Integer> p: points.entrySet()) {
            series1.getData().add(new XYChart.Data<>(Integer.toString(a), p.getValue()));
            a += 10;
        }*/
        barChartHistogram.getData().addAll(series1);
        _points = points;
    }

}
此窗口的.fxml文件:
<?xml version="1.0" encoding="UTF-8"?>

<?import javafx.scene.chart.BarChart?>
<?import javafx.scene.chart.CategoryAxis?>
<?import javafx.scene.chart.NumberAxis?>
<?import javafx.scene.layout.AnchorPane?>

<AnchorPane prefHeight="700.0" prefWidth="1000.0" xmlns="http://javafx.com/javafx/9.0.1" xmlns:fx="http://javafx.com/fxml/1" fx:controller="window.StatisticsController">
   <children>
      <BarChart fx:id="barChartHistogram" layoutX="12.0" layoutY="14.0" prefHeight="372.0" prefWidth="1500.0">
        <xAxis>
          <CategoryAxis side="BOTTOM" fx:id="xAxis" />
        </xAxis>
        <yAxis>
          <NumberAxis fx:id="yAxis" side="LEFT" />
        </yAxis>
      </BarChart>
   </children>
</AnchorPane>
除了一件事,一切都工作得很完美:
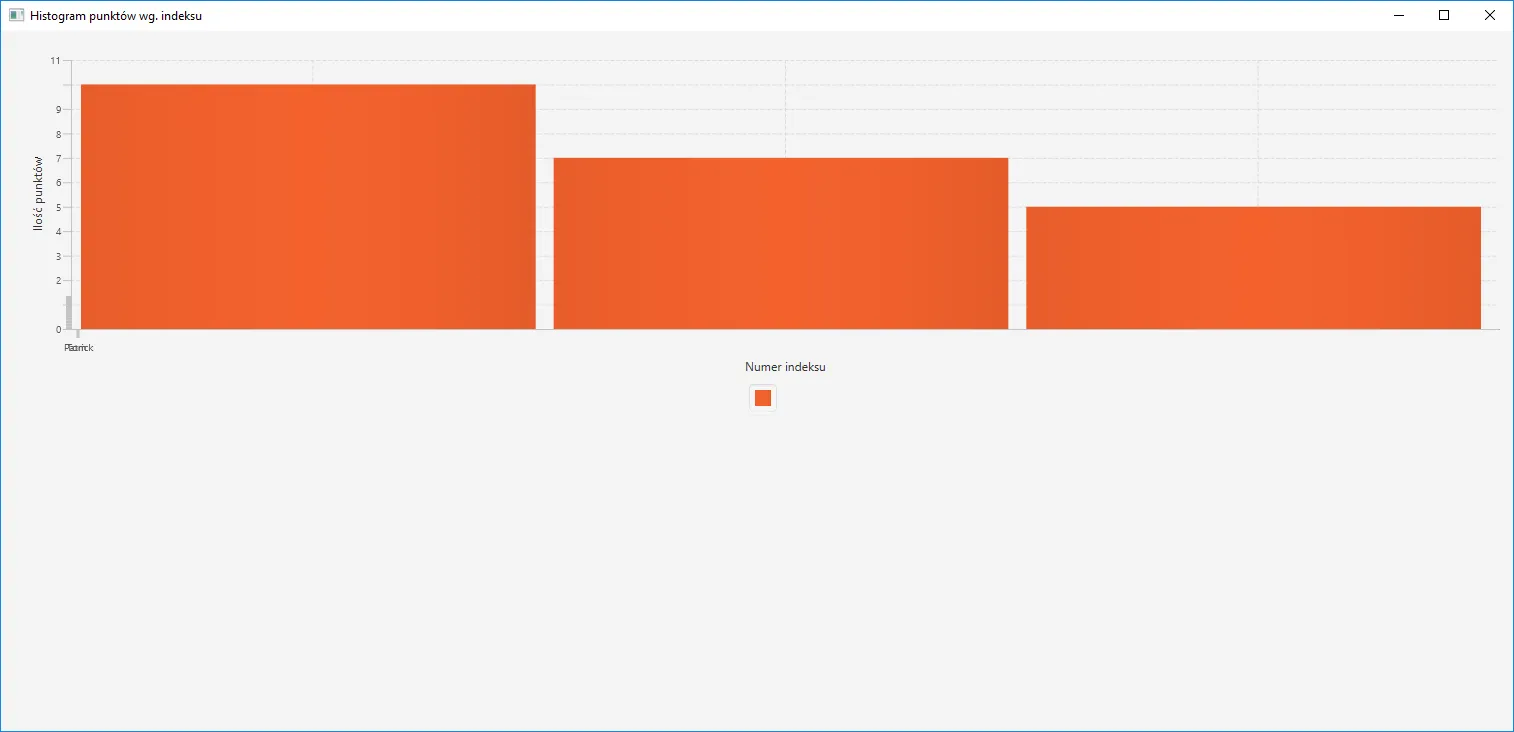
Tom、Andrew和Patrick,它们被放置在x轴的0位置上(通过这个混乱,您实际上可以读到Patrick)。问题出在哪里?我应该对UI进行一些更改吗?
Java 8。 - SedJ601