我有一个类似于以下情况的用例,其中我创建多个图表并使用gridExtra将它们排列成某些页面布局,最后使用ggsave将其保存为PDF:
p1 <- generate_ggplot1(...)
p2 <- generate_ggplot2(...)

final <- gridExtra::arrangeGrob(p1, p2, ...)
ggplot2::ggsave(filename=output.file,plot=final, ...)
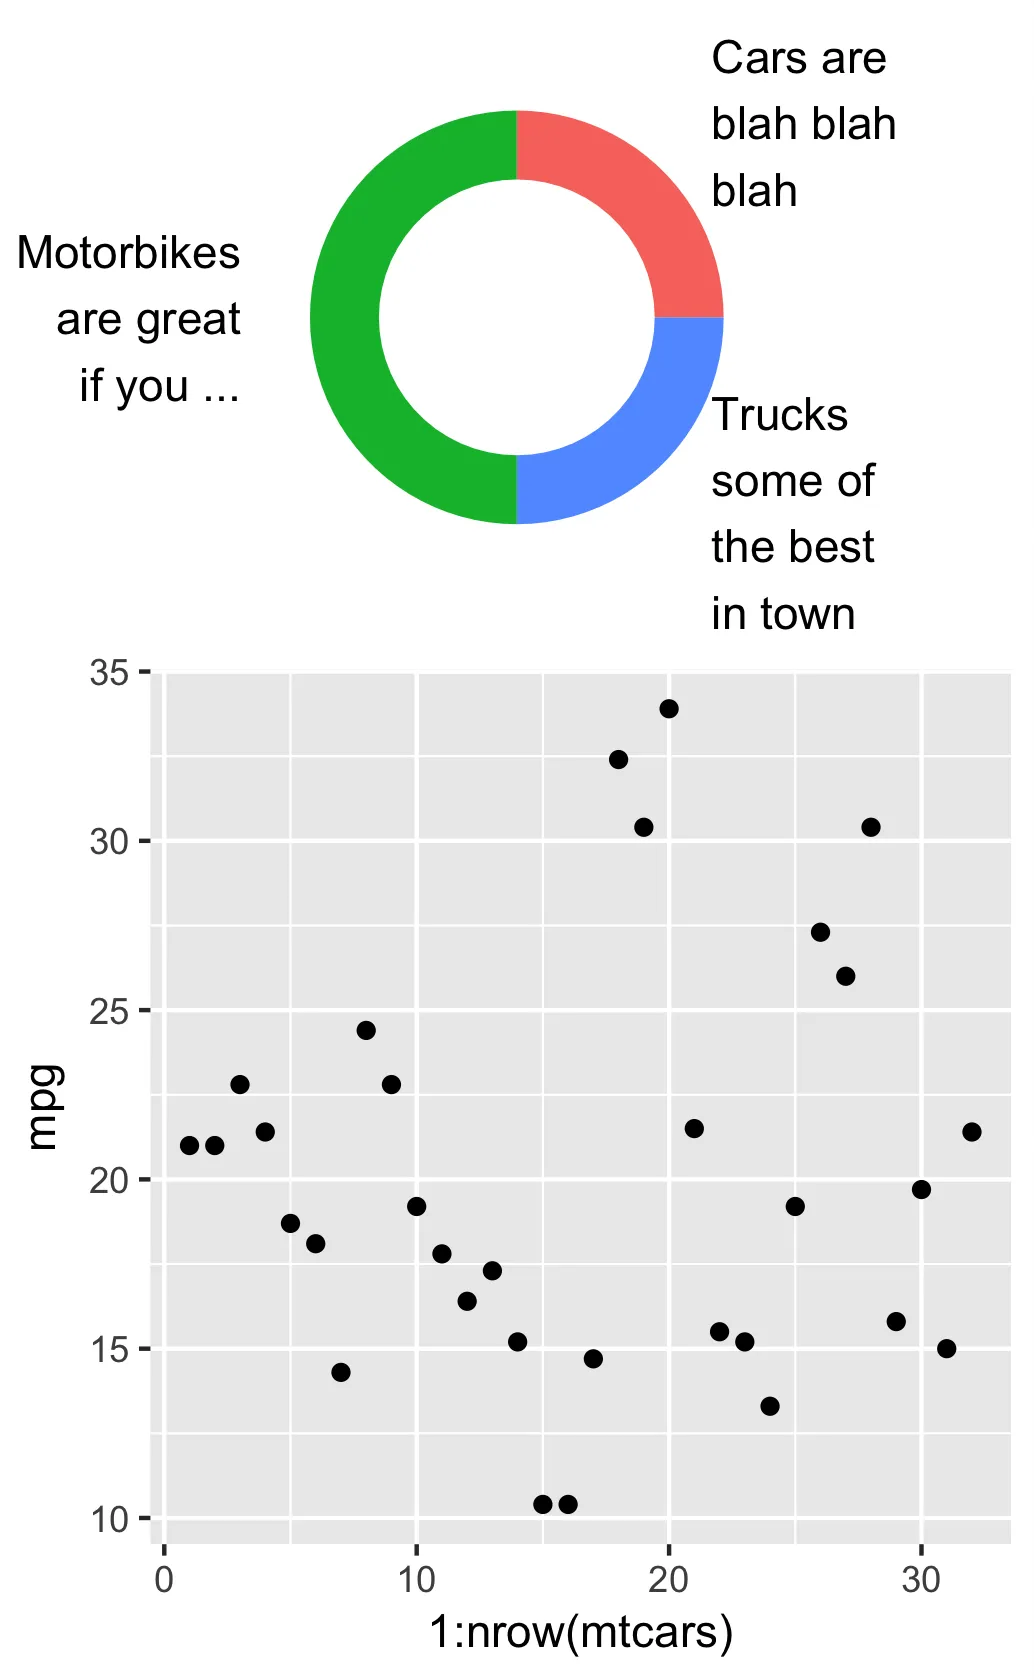
在使用arrangeGrob将图表p2放入页面布局时,是否可能对其进行裁剪?问题在于,p2顶部和底部有很多额外的空间,我想要摆脱它们,由于使用ggplot2时无法进行cropping,所以我在想,在排列时是否可以裁剪它...
更新这里是一个自包含的示例,我想通过任何方式消除红色标注的区域:
library(ggplot2); library(dplyr); library(stringr); library(gridExtra)
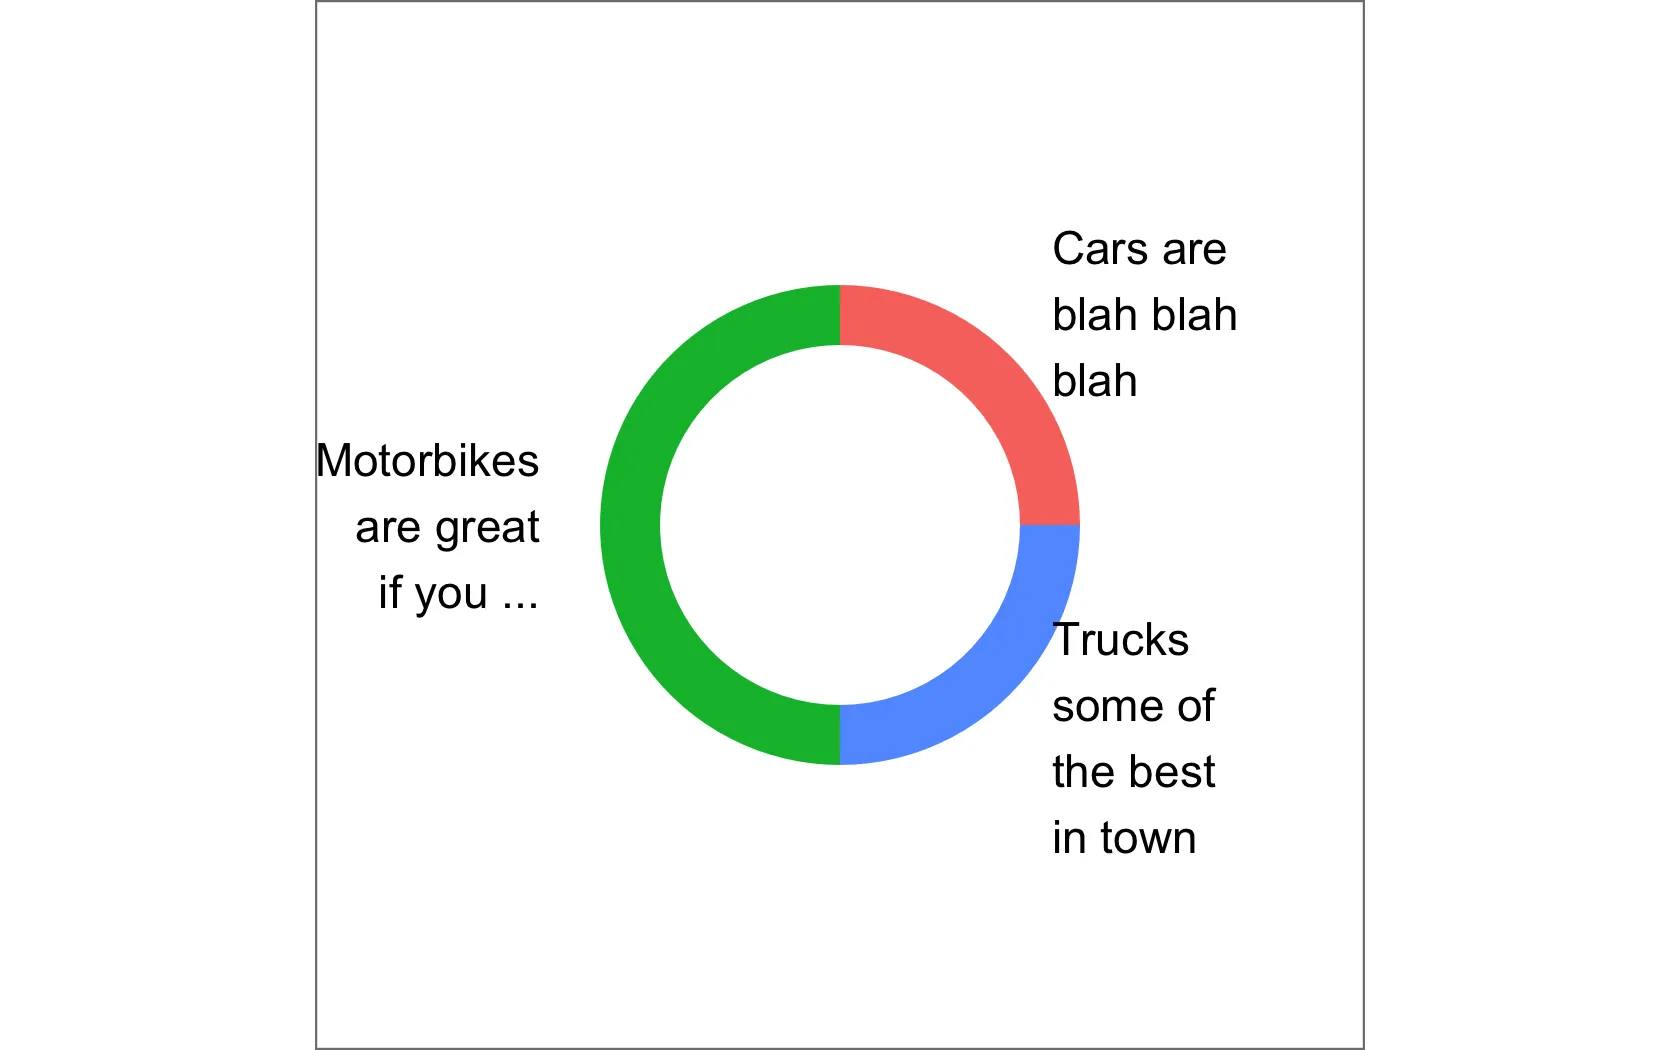
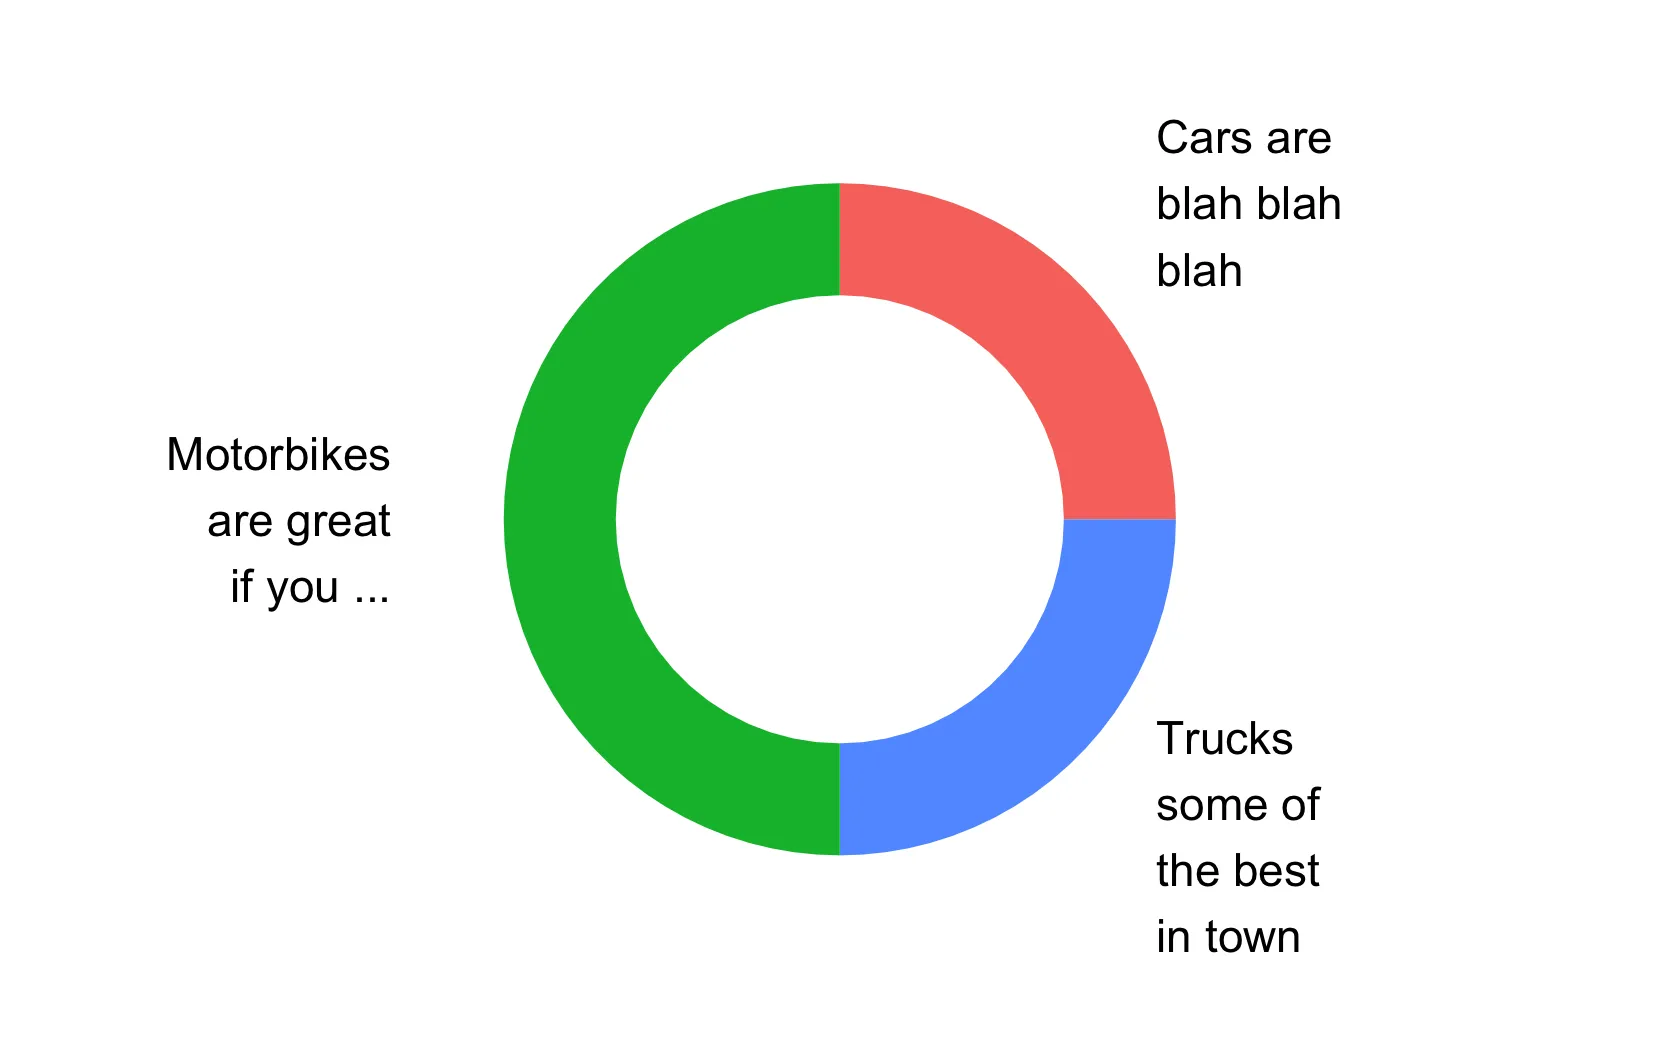
df <- data.frame(group = c("Cars", "Trucks", "Motorbikes"),n = c(25, 25, 50),
label2=c("Cars are blah blah blah", "Trucks some of the best in town", "Motorbikes are great if you ..."))
df$ymax = cumsum(df$n)
df$ymin = cumsum(df$n)-df$n
df$ypos = df$ymin+df$n/2
df$hjust = c(0,0,1)
p1 <- ggplot(mtcars,aes(x=1:nrow(mtcars),y=mpg)) + geom_point()
p2 <- ggplot(df %>%
mutate(label2 = str_wrap(label2, width = 10)), #change width to adjust width of annotations
aes(x="", y=n, fill=group)) +
geom_rect(aes_string(ymax="ymax", ymin="ymin", xmax="2.5", xmin="2.0")) +
expand_limits(x = c(2, 4)) + #change x-axis range limits here
# no change to theme
theme(axis.title=element_blank(),axis.text=element_blank(),
panel.background = element_rect(fill = "white", colour = "grey50"),
panel.grid=element_blank(),
axis.ticks.length=unit(0,"cm"),axis.ticks.margin=unit(0,"cm"),
legend.position="none",panel.spacing=unit(0,"lines"),
plot.margin=unit(c(0,0,0,0),"lines"),complete=TRUE) +
geom_text(aes_string(label="label2",x="3",y="ypos",hjust="hjust")) +
coord_polar("y", start=0) +
scale_x_discrete()
final <- arrangeGrob(p1,p2,layout_matrix = rbind(c(1),c(2)),
widths=c(4),heights=c(4,4), padding=0.0,
respect=TRUE, clip="on")
plot(final)
输出结果如下:
arrangeGrob排列之前,使用theme修改绘图边距怎么样? - mikeck