当我运行这段代码时
from pylab import *
figure()
ax1 = subplot(121)
plot([1, 2, 3], [1, 2, 3])
subplot(122, sharex=ax1, sharey=ax1)
plot([1, 2, 3], [1, 2, 3])
draw()
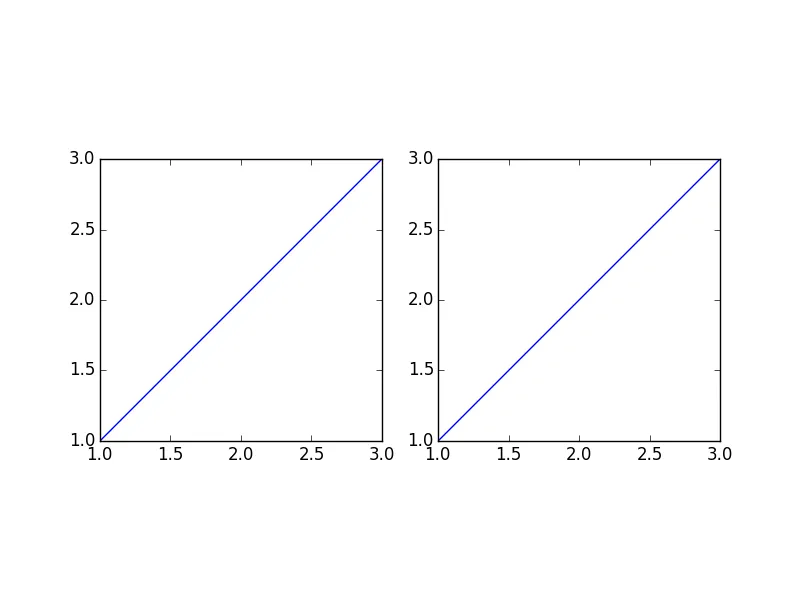
show()
我的两个子图在X轴方向上被“挤压”了。我该如何使这些子图的Y轴高度等于X轴宽度,对于两个子图都是这样呢?
我正在Ubuntu 10.04上使用matplotlib v.0.99.1.2。
更新2010-07-08:让我们看看一些无法解决问题的方法。
在整天的谷歌搜索后,我认为可能与自动缩放有关。所以我尝试调整了一下。
from pylab import *

figure()
ax1 = subplot(121, autoscale_on=False)
plot([1, 2, 3], [1, 2, 3])
subplot(122, sharex=ax1, sharey=ax1)
plot([1, 2, 3], [1, 2, 3])
draw()
show()
Matplotlib 坚持自动缩放。
from pylab import *

figure()
ax1 = subplot(121, autoscale_on=False)
plot([1, 2, 3], [1, 2, 3])
subplot(122, sharex=ax1, sharey=ax1, autoscale_on=False)
plot([1, 2, 3], [1, 2, 3])
draw()
show()
在这个例子中,数据完全消失了。Matplotlib究竟怎么了?就是这样?
好吧,也许如果我们修复它的纵横比呢?
from pylab import *

figure()
ax1 = subplot(121, autoscale_on=False)
plot([1, 2, 3], [1, 2, 3])
axes().set_aspect('equal')
subplot(122, sharex=ax1, sharey=ax1)
plot([1, 2, 3], [1, 2, 3])
draw()
show()
这个问题会导致第一个子图完全消失。太搞笑了!是谁想出来的?
说真的,这应该是一个很难实现的事情吗?
subplots选项中使用subplot_kw = {'adjustable':'box-forced','aspect':'equal'}。现在唯一的问题是,“共享”轴仍然显示轴标签... - rubenvbadjustable='box-forced'的API描述?我有点疯了... - Atcold