我正在使用非常棒的ggplot2库。我已经通过使用coord_fixed来设置绘图的纵横比。现在,我想将图形保存为PDF,并指定宽度(例如10厘米),让所需高度自动计算。我没有弄清楚如何实现这一点。这是否可行?
5个回答
15
您可以使用网格函数来计算ggplot grob的完整大小,但有(编辑:至少)两个注意事项:
会打开一个额外的设备窗口,以进行单位转换
默认情况下,绘图面板大小为0,因为它是根据其所在的设备(视口)即时计算的,而不是相反。
话虽如此,以下功能试图打开与ggplot完全匹配的设备,
library(ggplot2)
library(grid)
sizeit <- function(p, panel.size = 2, default.ar=1){
gb <- ggplot_build(p)
# first check if theme sets an aspect ratio
ar <- gb$plot$coordinates$ratio
# second possibility: aspect ratio is set by the coordinates, which results in
# the use of 'null' units for the gtable layout. let's find out
g <- ggplot_gtable(gb)
nullw <- sapply(g$widths, attr, "unit")
nullh <- sapply(g$heights, attr, "unit")
# ugly hack to extract the aspect ratio from these weird units
if(any(nullw == "null"))
ar <- unlist(g$widths[nullw == "null"]) / unlist(g$heights[nullh == "null"])
if(is.null(ar)) # if the aspect ratio wasn't specified by the plot
ar <- default.ar
# ensure that panel.size is always the larger dimension
if(ar <= 1 ) panel.size <- panel.size / ar
g$fullwidth <- convertWidth(sum(g$widths), "in", valueOnly=TRUE) +
panel.size
g$fullheight <- convertHeight(sum(g$heights), "in", valueOnly=TRUE) +
panel.size / ar
class(g) <- c("sizedgrob", class(g))
g
}
print.sizedgrob <- function(x){
# note: dev.new doesn't seem to respect those parameters
# when called from Rstudio; in this case it
# may be replaced by x11 or quartz or ...
dev.new(width=x$fullwidth, height=x$fullheight)
grid.draw(x)
}
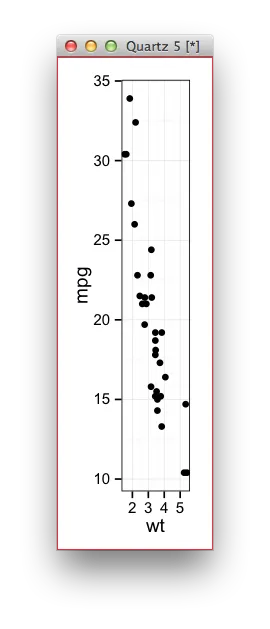
p1 <- ggplot(mtcars, aes(x = wt, y = mpg)) + geom_point() + coord_fixed() +
theme(plot.background = element_rect(colour = "red"))
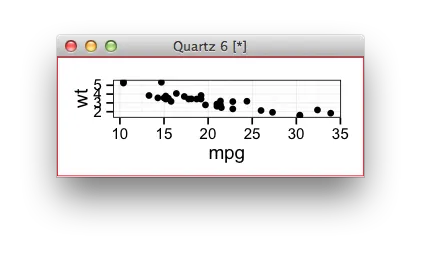
p2 <- p1 + aes(x = mpg, y = wt)
# need for an explicit dummy device open, otherwise it's a bit off
# for no apparent reason that I can understand
dev.new()
sizeit(p1, 0.1)
sizeit(p2, 2)
- baptiste
3
5
根据baptiste的答案,我简化了他的代码,并按照geotheory的建议返回了纵横比。这对我来说更加方便,因为我要么需要固定的宽度或高度,并且还通过现有的包装函数传递所有内容,该函数还将字体添加到我的pdf中。
哦,如果你使用了facets,你需要手动考虑它们。按行除以列数再乘以列数。不确定是否有更好的方法.....
ggGetAr <- function(p, default.ar=-1){

    gb <- ggplot_build(p)
    # first check if theme sets an aspect ratio
    ar <- gb$plot$coordinates$ratio

    # second possibility: aspect ratio is set by the coordinates, which results in
    # the use of 'null' units for the gtable layout. let's find out
    g <- ggplot_gtable(gb)
    nullw <- sapply(g$widths, attr, "unit")
    nullh <- sapply(g$heights, attr, "unit")

    # ugly hack to extract the aspect ratio from these weird units
    if(any(nullw == "null"))
        ar <- unlist(g$widths[nullw == "null"]) / unlist(g$heights[nullh == "null"])

    if(is.null(ar)) # if the aspect ratio wasn't specified by the plot
        ar <- default.ar

    ar[1]
}
- Morty
4
如果您使用ggsave,您可以简单地指定图形设备的宽度和高度。如果您指定了绘图本身的纵横比,那么在图形设备中也最好具有这个纵横比(大致相同)。当保存pdf时,height和width的单位是英寸:
ggplot(...) # make a plot here
ggsave("plot.pdf", width = 10)
现在你只需将10厘米转换为英寸。此外,如果您没有指定特定的宽高比,height 不会被强制设置。如果您想要16:9的宽高比,则可以根据宽度轻松计算出高度:
ggplot(...) # make plot
width = 10
height = (9/16) * width
ggsave("plot.pdf", width = width, height = height)
如果你真的想要,你可以将这个内容封装在一个函数中。
编辑:关键是通过coord_fixed()同步绘图的纵横比和图形设备的纵横比。例如
library(ggplot2)
ggplot(mtcars, aes(x = wt, y = mpg)) + geom_point() + coord_fixed()
ggsave("plt.png", width = 7, height = 7)
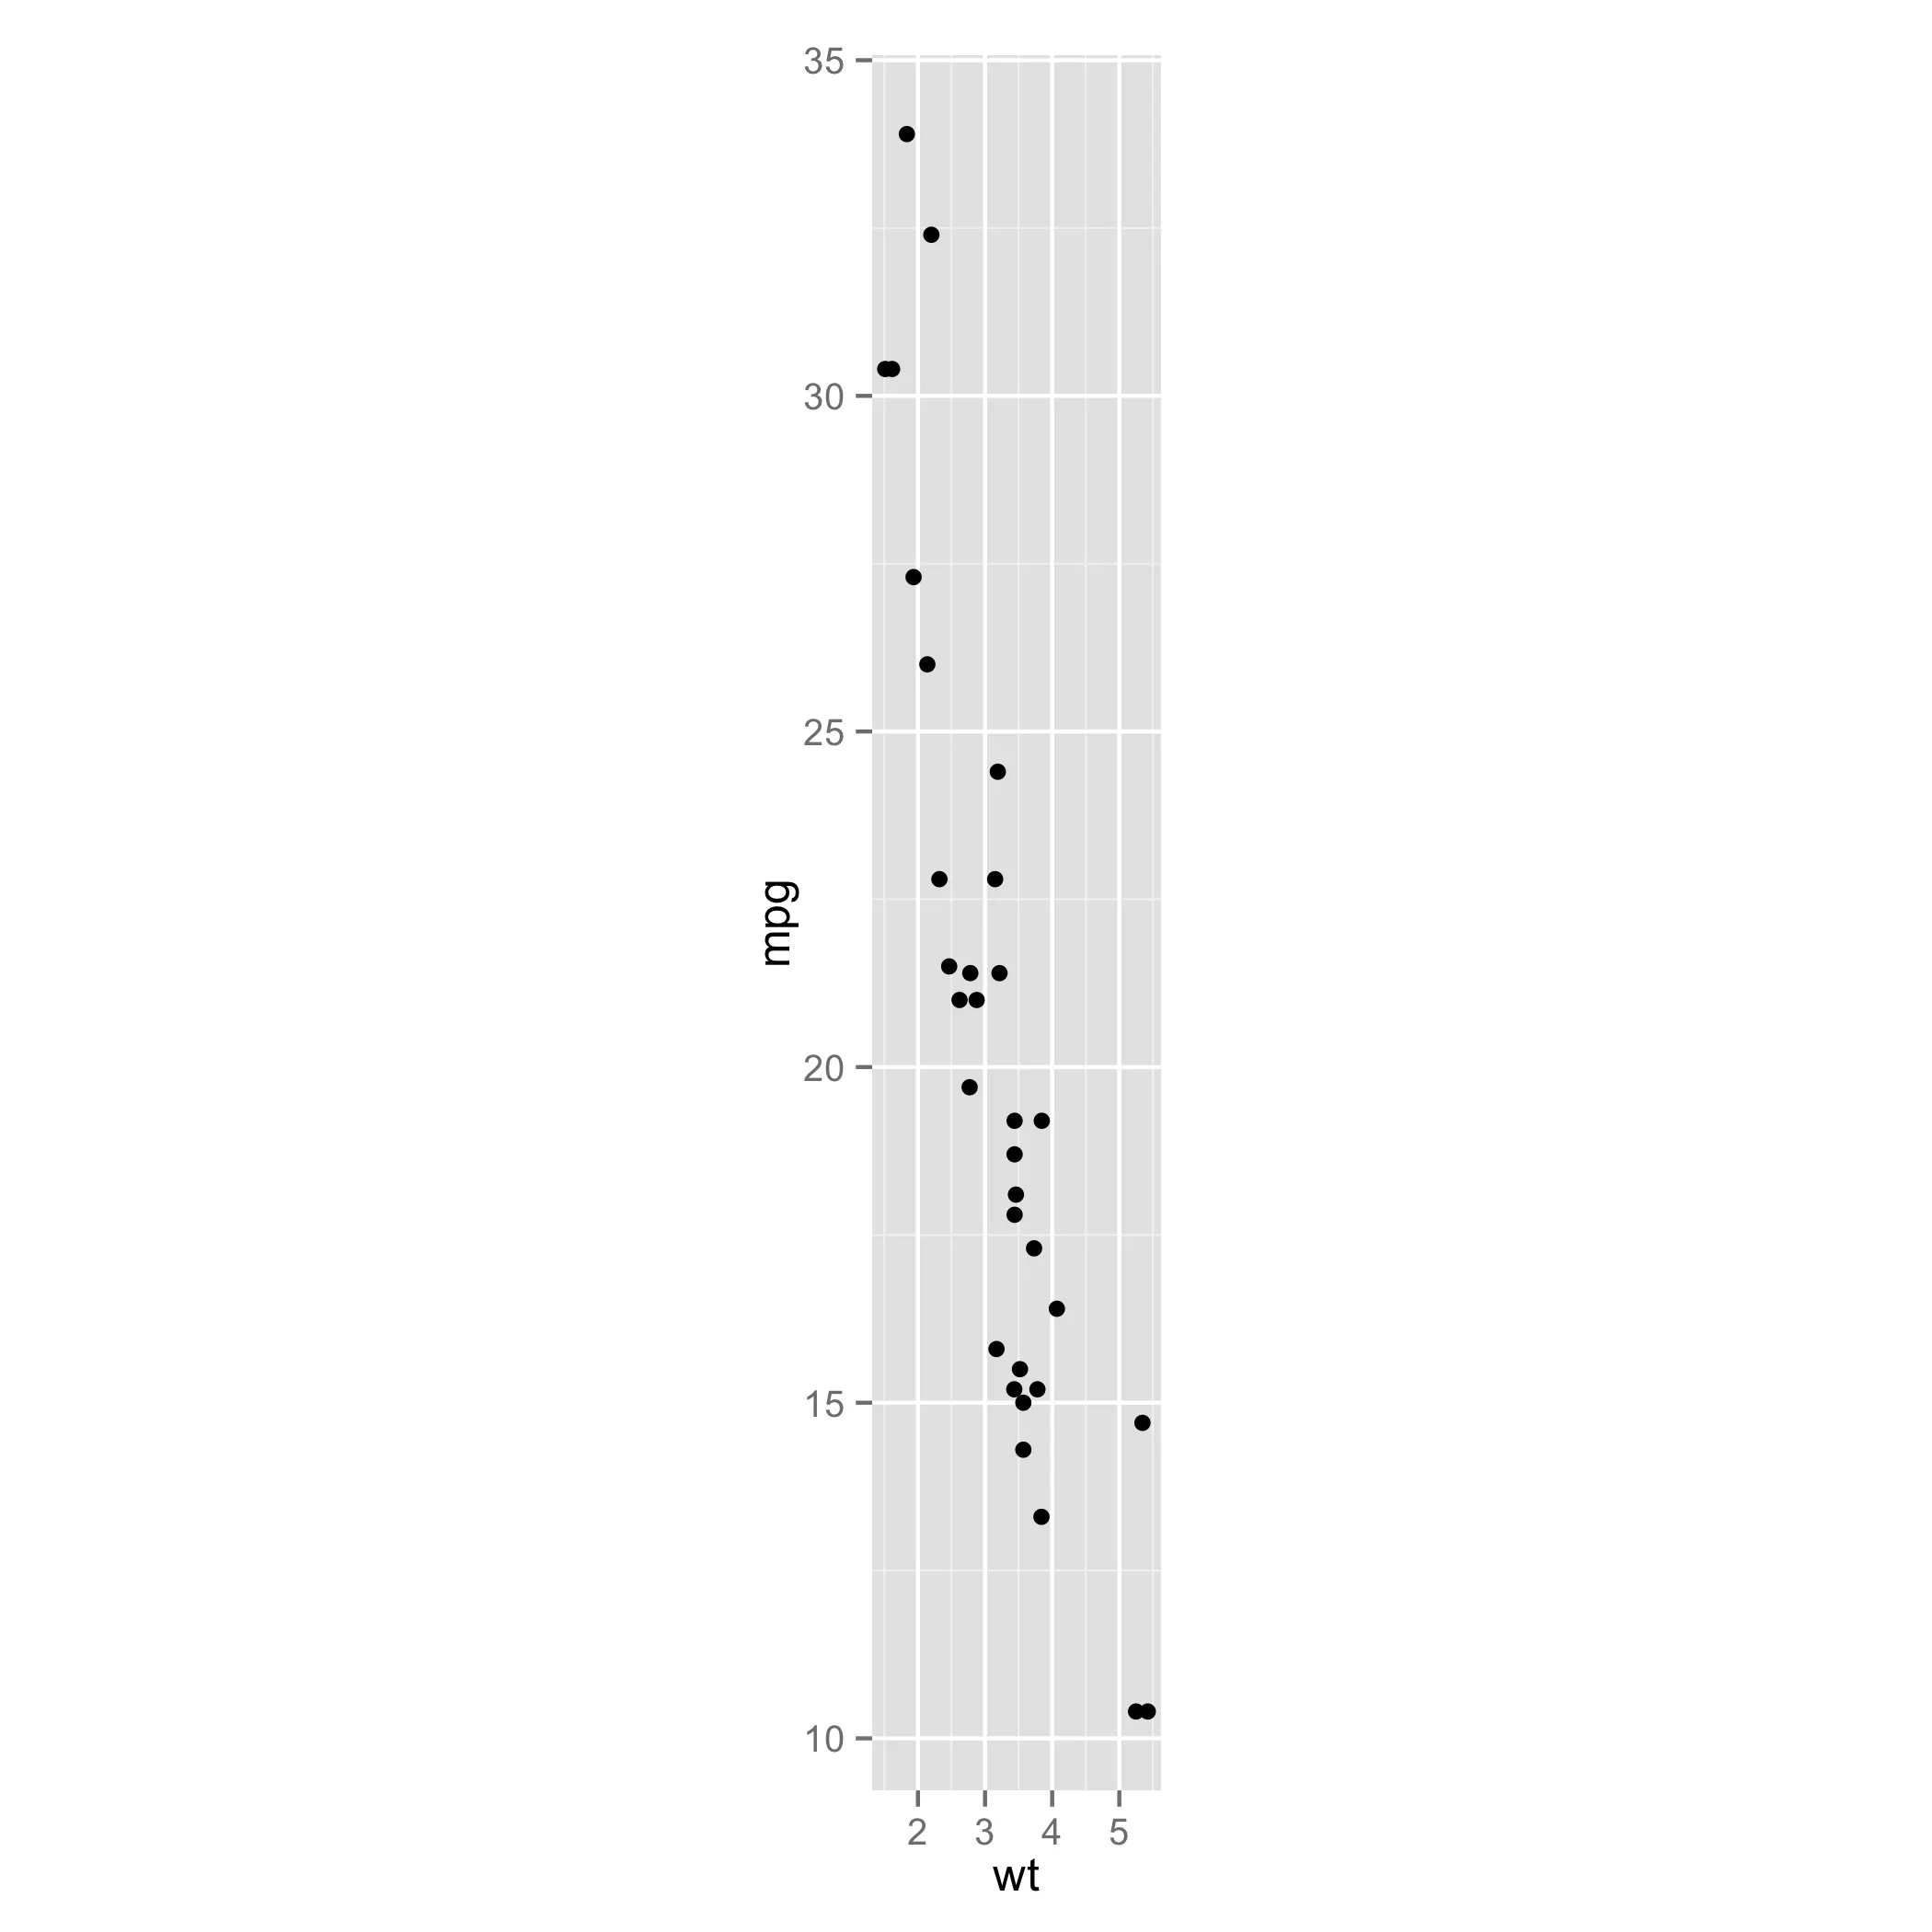 会导致很多空白区域。而以下的
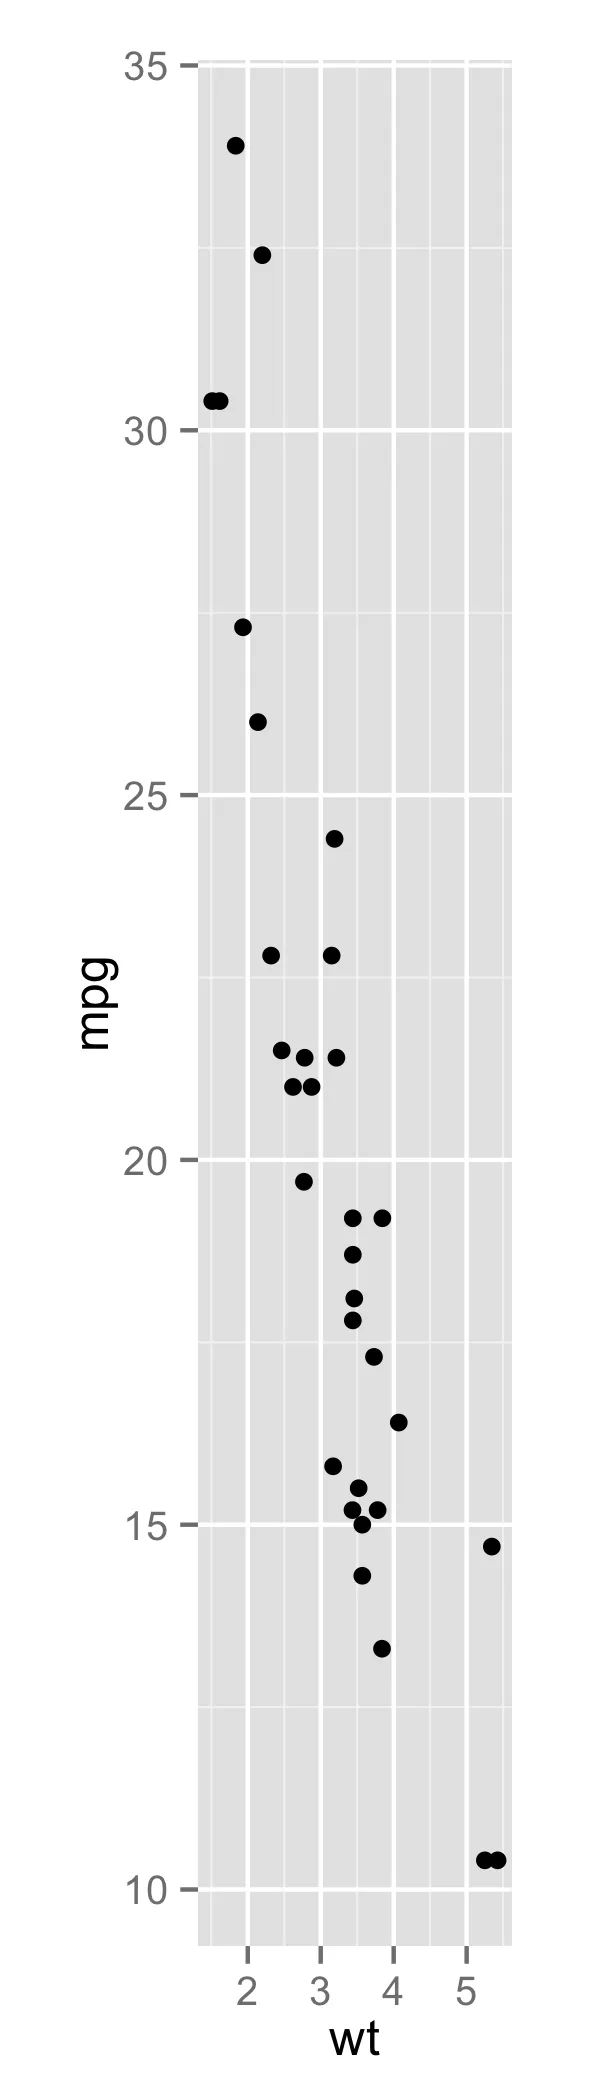
 ggsave 函数调用,其长宽比更合适,没有这么多的空白区域(对于这张大图片,抱歉无法设置最大尺寸 :)):
ggsave("plt.png", width = 2, height = 7)
- Paul Hiemstra
2
3我认为保罗,但那是设备的大小,而不是图形。一旦你添加了标题、轴标签和图例等,绘图区域本身可能不是正方形的,使用
coord_fixed()后,绘图区域本身就无法填满可用空间。我不知道除了调整绘图窗口大小直到没有指定宽度的ggsave()生成10厘米宽的图像之外,有什么好的解决方法。 - Gavin Simpson谢谢Paul的回答。Gavin,就像你在评论中指出的那样。我认为这是一个相当大的问题,需要手动裁剪每个图。让我们等待看看是否有人提出解决方案。 - marsl
2
不确定,但是类似这样的东西是否符合您的要求?
ggplot(data.frame(x = seq(10), y = seq(10)), aes(x = x, y = y)) +
    geom_point() +
    coord_equal() +
    theme(aspect.ratio = 1)
我认为这看起来很好:
ggsave("test.pdf", width = 4, height = 4)
太多的空白,但图形本身的长宽比是1:
ggsave("test2.pdf", width = 4)
消息: 正在保存 4 x 6.93 英寸的图像
- Dennis
1
3谢谢你的回答Dennis。不幸的是,它不适合我的问题,因为“ggsave”默认只使用当前绘图窗口的大小。 - marsl
1
一个更简单的解决方案是使用默认边距保存绘图,并使用ImageMagick裁剪生成的png文件。
require(ggplot2)
require(dplyr)

ggplot(iris, aes(Sepal.Length, Sepal.Width)) + geom_point() + coord_fixed(0.3)
ggsave("untrimmed.png")


system("convert untrimmed.png -trim -bordercolor white -border 20  reframed.png")
- Holger Brandl
1
这对我来说完美地运作了——我曾担心系统调用需要安装额外的软件,但实际上并不需要(对我而言)。 - hasManyStupidQuestions
网页内容由stack overflow 提供, 点击上面的可以查看英文原文,
原文链接
原文链接
sizeit(p1, 0.1)并将其保存为 pdf 文件时,输出结果的轴被奇怪地转置了。我认为最好使用一个返回宽高比的函数来确定 ggsave 的宽度和高度参数。 - geotheory