我正在尝试编写一个函数,其中我们公司的标志将自动添加到每个图表中,并作为功能的一部分导出到标题和副标题旁边。每个输出的尺寸将取决于当时的需求,因此设定固定的尺寸不会特别有帮助。
为了实现这一点,我已经生成了一系列网格来组合所有元素,如下所示(使用鸢尾花数据集)。
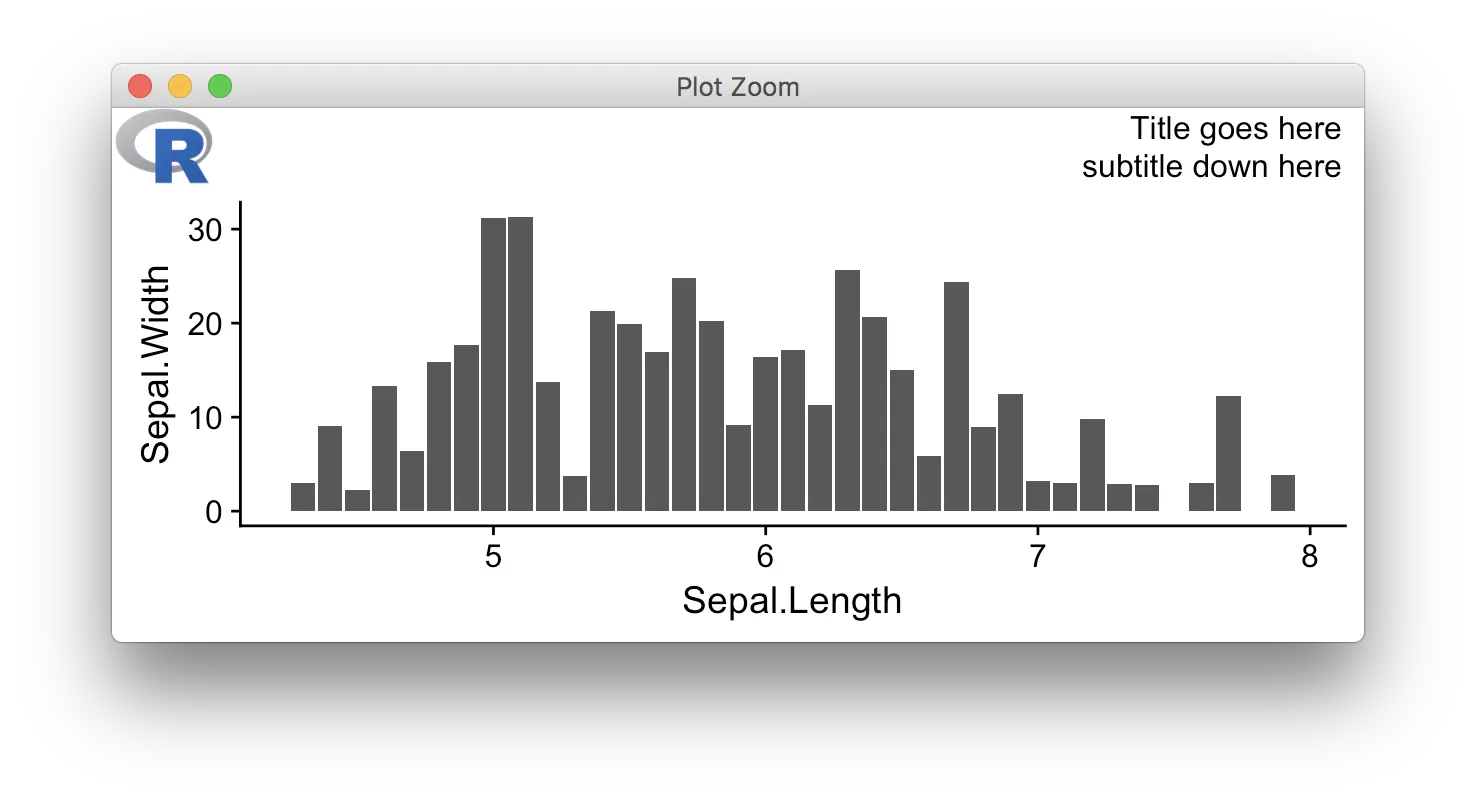
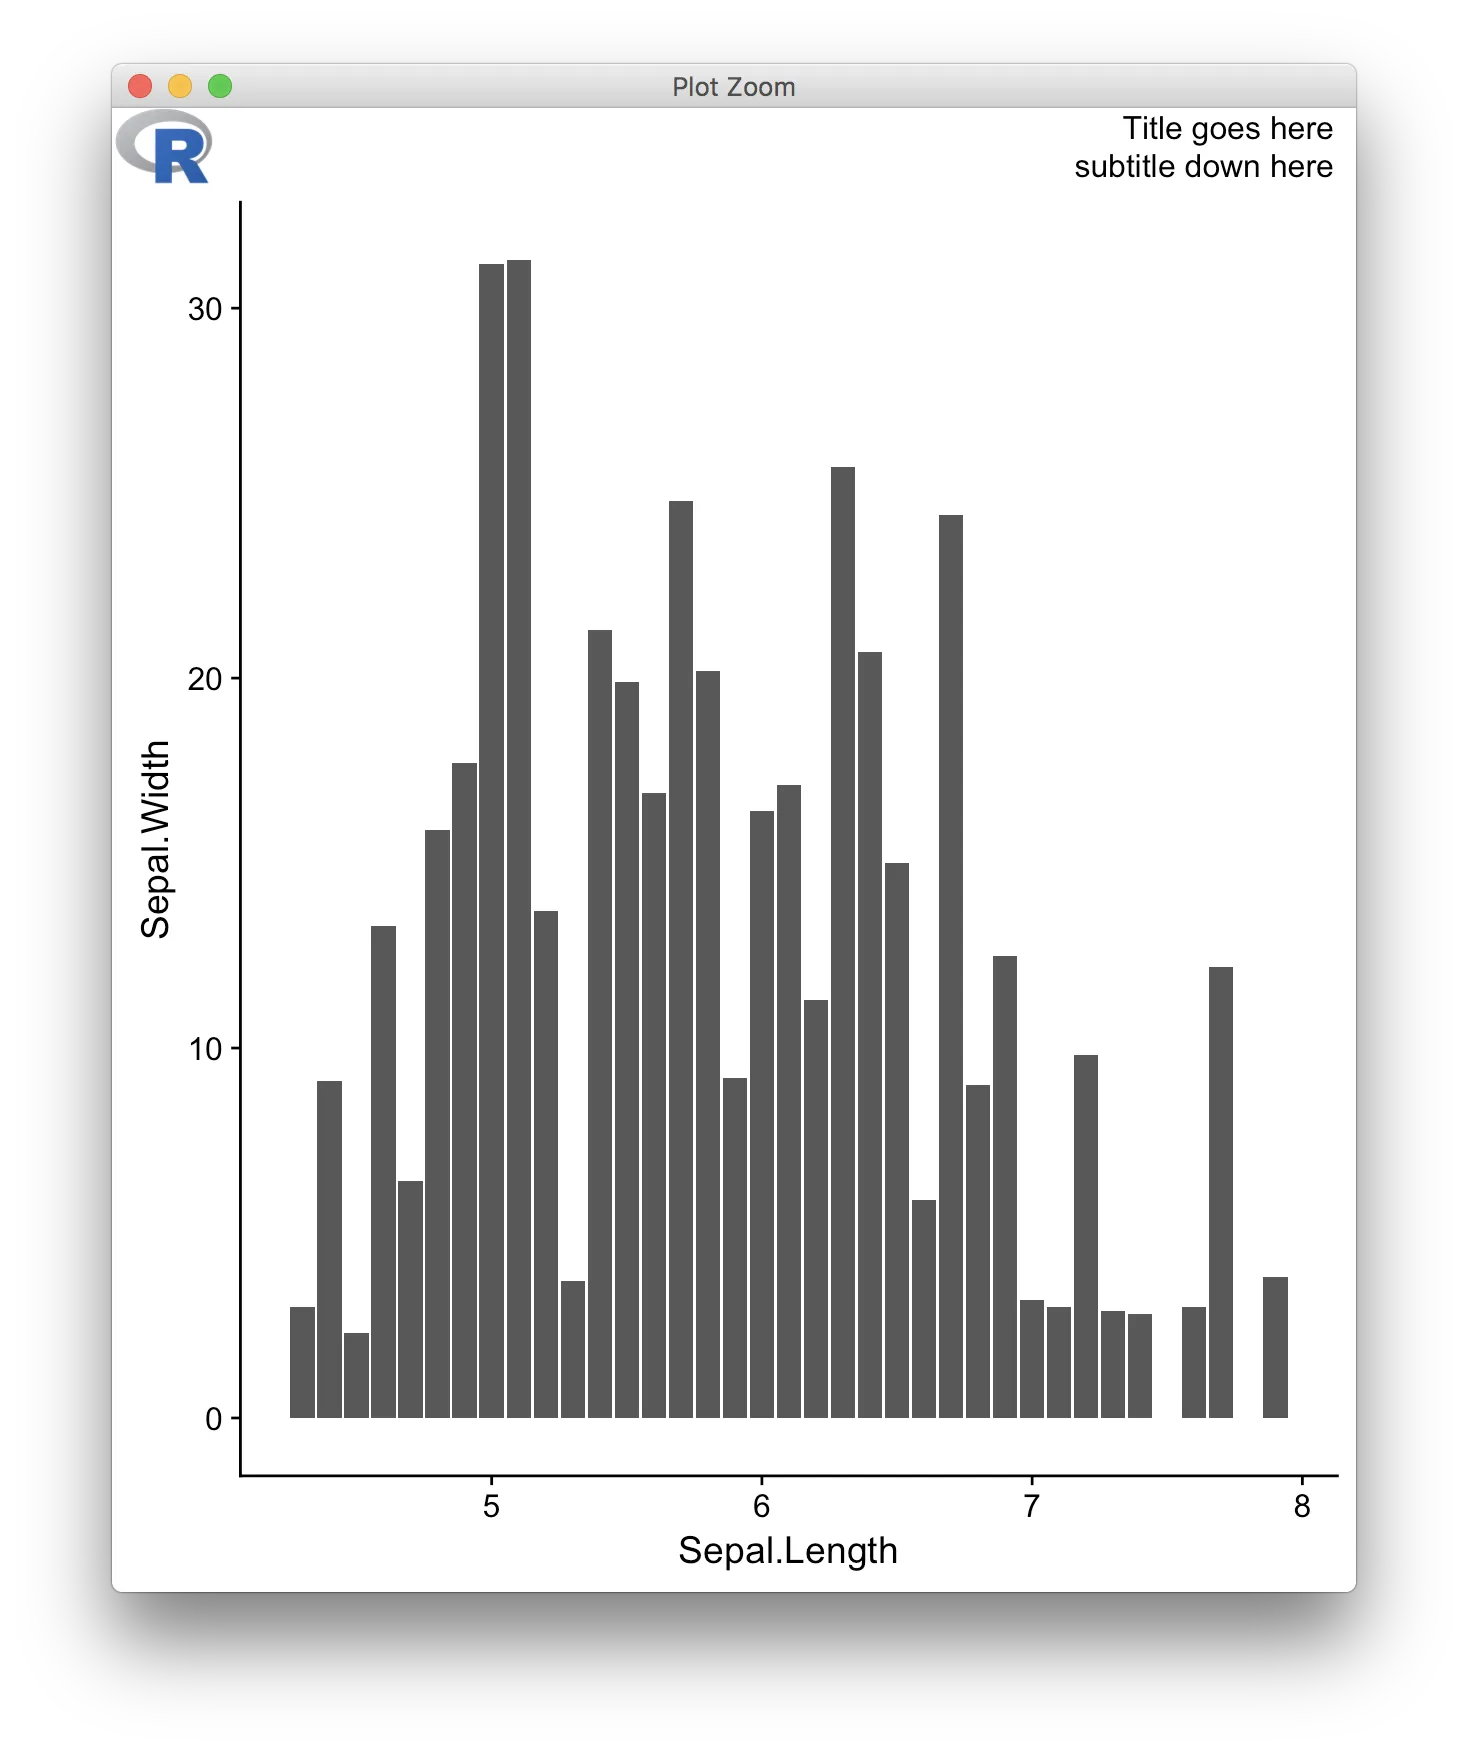
以下是不同宽高比下的输出结果。
 第一个示例的标题和副标题之间有足够的空隙,而第二个示例中则过多。如何使
为了实现这一点,我已经生成了一系列网格来组合所有元素,如下所示(使用鸢尾花数据集)。
library(datasets)
library(tidyverse)
library(gridExtra)
library(grid)
library(png)

m <- readPNG("Rlogo.png") # download from: https://www.r-project.org/logo/Rlogo.png

plot <- ggplot(iris, aes(x = Sepal.Length, y = Sepal.Width)) +
  geom_col() +
  ggtitle("Title goes here",
          subtitle = "subtitle down here")


txtTitle <- plot$labels$title
txtSubTitle <- plot$labels$subtitle

plot$labels$title <- NULL
plot$labels$subtitle <- NULL

buffer <- grobTree(rectGrob(gp = gpar(fill = "white", col = "white")))

Title <- grobTree(textGrob(label = txtTitle,
                           hjust = 1,
                           x = 0.98))
SubTitle <- textGrob(label = txtSubTitle,
                     hjust = 1,
                     x = 0.98)
Logo <- grobTree(rasterGrob(m, x = 0.02, hjust = 0))


TitlesGrid <- grid.arrange(Title, SubTitle, ncol = 1)
TopGrid <- grid.arrange(Logo, TitlesGrid, widths = c(1, 7), ncol = 2)
AllGrid <- grid.arrange(TopGrid, arrangeGrob(plot), heights = c(1,7))
以下是不同宽高比下的输出结果。
第一个示例的标题和副标题之间有足够的空隙,而第二个示例中则过多。如何使TopGrid的高度固定为绝对大小,但其余部分可按需填充?