如何增加两个特定matplotlib子图之间的水平空间(hspace)?

3
f = plt.figure(figsize=(12,10))

ax1 = f.add_subplot(411)
ax2 = f.add_subplot(422)
ax3 = f.add_subplot(423)
ax4 = f.add_subplot(424)
ax5 = f.add_subplot(425)
ax6 = f.add_subplot(426)
ax7 = f.add_subplot(427)
ax8 = f.add_subplot(428)

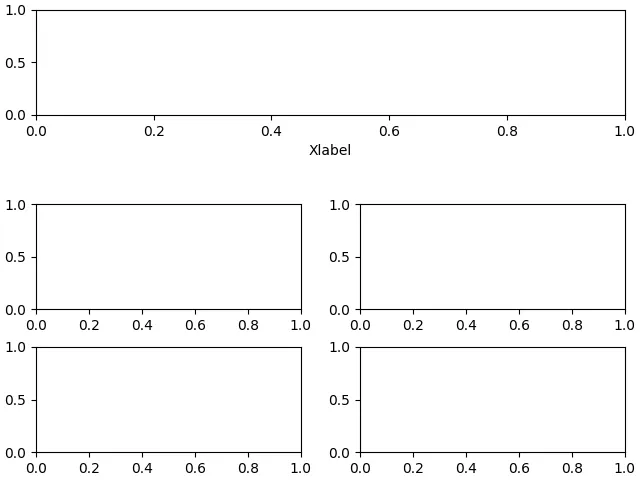
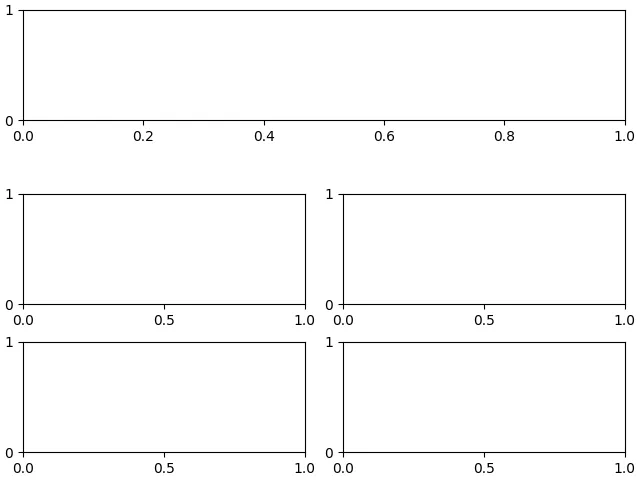
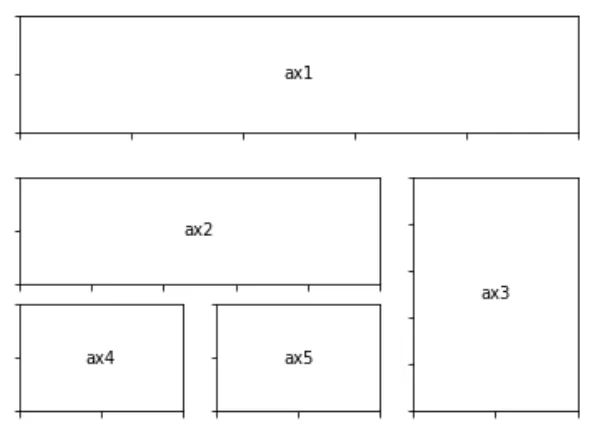
我想增加两行之间的间距:ax1和ax2-ax3。其他间距应保持不变。使用“f.subplots_adjust(hspace=0.2, wspace=0.25)”会调整所有子图的间距。我该如何只增加顶部子图的hspace?

一个技巧是将ax2的标题添加一个空格,即ax2.set_title(“ “),然后使用constrained_layout。 - Jody Klymak
2个回答

1
import matplotlib.pyplot as plt 

fig, axs = plt.subplot_mosaic([['top', 'top'],['left1', 'right1'], ['left2', 'right2']], 
                              constrained_layout=True)
axs['top'].set_xlabel('Xlabel\n\n')
plt.show()

这将使所有的y轴大小相同。如果这对你不重要,那么@r-beginners的答案是有帮助的。请注意,您不需要使用subplot mosaic,尽管它是一个有用的新功能。

enter image description here

如果您不担心轴大小匹配的问题,那么比上面提出的方法稍微好一点的方法是使用新的子图功能:
import matplotlib.pyplot as plt 

fig = plt.figure(constrained_layout=True)

subfigs = fig.subfigures(2, 1, height_ratios=[1, 2], hspace=0.15)

# top 
axtop = subfigs[0].subplots()

# 2x2 grid
axs = subfigs[1].subplots(2, 2)

plt.show()

enter image description here


0

基于官方参考文献中的网格示例,我使用了这个答案进行自定义。重点是要使用网格规范来配置您想要的单独图形。

import matplotlib.pyplot as plt
from matplotlib.gridspec import GridSpec


def format_axes(fig):
    for i, ax in enumerate(fig.axes):
        ax.text(0.5, 0.5, "ax%d" % (i+1), va="center", ha="center")
        ax.tick_params(labelbottom=False, labelleft=False)

fig = plt.figure()

gs_top = GridSpec(3, 3, top=0.95)
gs_base = GridSpec(3, 3)
ax1 = fig.add_subplot(gs_top[0, :])
# identical to ax1 = plt.subplot(gs.new_subplotspec((0, 0), colspan=3))
ax2 = fig.add_subplot(gs_base[1, :-1])
ax3 = fig.add_subplot(gs_base[1:, -1])
ax4 = fig.add_subplot(gs_base[-1, 0])
ax5 = fig.add_subplot(gs_base[-1, -2])

# fig.suptitle("GridSpec")
format_axes(fig)

plt.show()

enter image description here


网页内容由stack overflow 提供, 点击上面的
可以查看英文原文,
原文链接