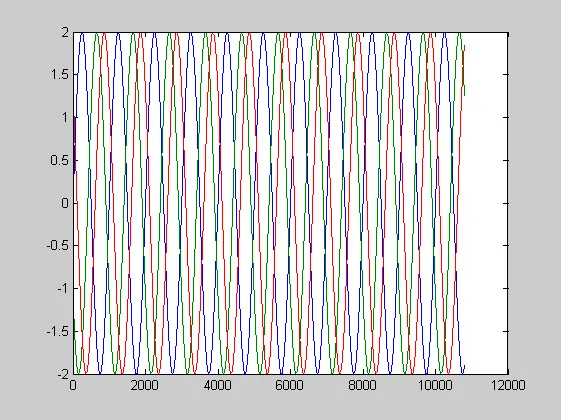
我生成了三个相同的波形,每个波形都有一个相位偏移。例如:
t = 1:10800; % generate time vector
fs = 1; % sampling frequency (seconds)
A = 2; % amplitude
P = 1000; % period (seconds), the time it takes for the signal to repeat itself
f1 = 1/P; % number of cycles per second (i.e. how often the signal repeats itself every second).
y1 = A*sin(2*pi*f1*t); % signal 1
phi = 10; % phase shift
y2 = A*sin(2*pi*f1*t + phi); % signal 2
phi = 15; % phase shift
y3 = A*sin(2*pi*f1*t + phi); % signal 3

YY = [y1',y2',y3'];

plot(t,YY)
我现在想使用一种方法来检测这些波之间的相位差。这样做的目的是为了最终将该方法应用于真实数据,并识别信号之间的相位差。
到目前为止,我一直在考虑计算每个波与第一个波(即没有相位差的波)之间的交叉谱:
for i = 1:3;
    [Pxy,Freq] = cpsd(YY(:,1),YY(:,i));
    coP = real(Pxy);
    quadP = imag(Pxy);
    phase(:,i) = atan2(coP,quadP);
end
但我不确定这是否有意义。
有人做过类似的事情吗?期望的结果应该在第二和第三波分别显示出10和15的相移。
任何建议都将不胜感激。