我使用自动轴范围来显示数据。
例如,当我的x数据在-29到+31之间时,我会这样做:
ax = plt.gca()
xsta, xend = ax.get_xlim()
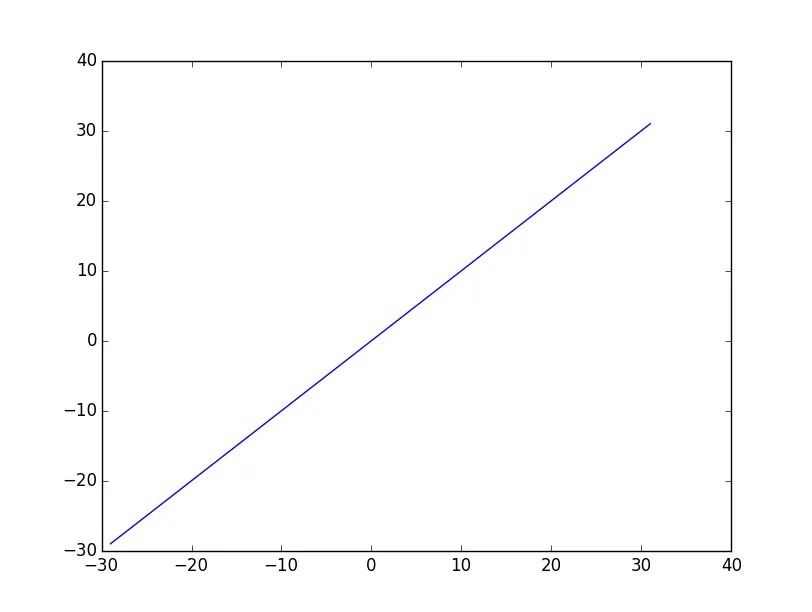
我得到了-30和40,这并不能恰当地描述数据范围。我希望看到轴范围舍入为5,即限制值为-30和35。
能否做到这一点?或者,是否可以获取x轴数据的确切范围(-29,31),然后编写算法手动更改它(使用set_xlim)?
感谢您的帮助。
我使用自动轴范围来显示数据。
例如,当我的x数据在-29到+31之间时,我会这样做:
ax = plt.gca()
xsta, xend = ax.get_xlim()
首先,让我们设置一个简单的示例:
import matplotlib.pyplot as plt

fig, ax = plt.subplots()
ax.plot([-29, 31], [-29, 31])
plt.show()
ax.xaxis.get_data_interval()
ax.yaxis.get_data_interval()
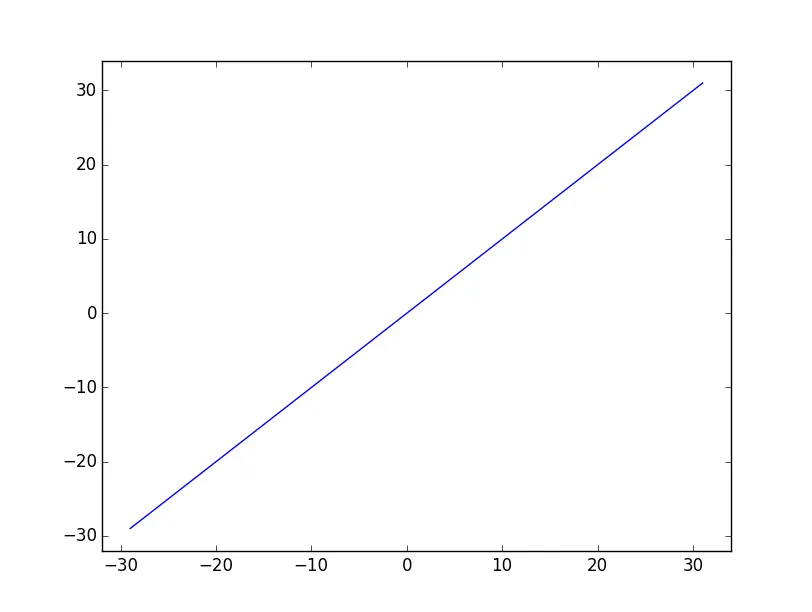
ax.margins(some_percentage)。例如,这将使用数据范围的5%来填充限制:import matplotlib.pyplot as plt
fig, ax = plt.subplots()
ax.plot([-29, 31], [-29, 31])
ax.margins(0.05)
plt.show()
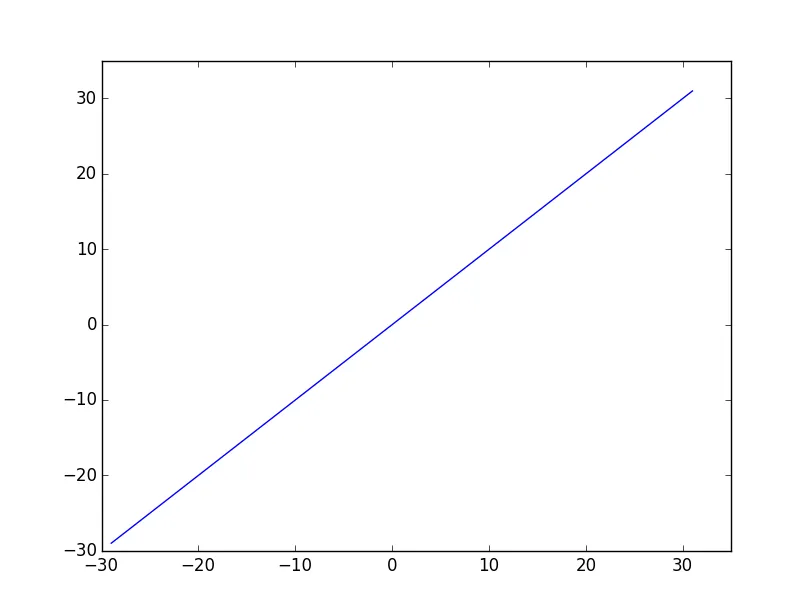
如果要返回到原始情景,您可以手动使坐标轴限制仅使用5的倍数(但不更改刻度等):
import numpy as np
import matplotlib.pyplot as plt

fig, ax = plt.subplots()
ax.plot([-29, 31], [-29, 31])

multiplier = 5.0
for axis, setter in [(ax.xaxis, ax.set_xlim), (ax.yaxis, ax.set_ylim)]:
    vmin, vmax = axis.get_data_interval()
    vmin = multiplier * np.floor(vmin / multiplier)
    vmax = multiplier * np.ceil(vmax / multiplier)
    setter([vmin, vmax])

plt.show()
import numpy as np
import matplotlib.pyplot as plt
from matplotlib.ticker import AutoLocator

class MyLocator(AutoLocator):
    def view_limits(self, vmin, vmax):
        multiplier = 5.0
        vmin = multiplier * np.floor(vmin / multiplier)
        vmax = multiplier * np.ceil(vmax / multiplier)
        return vmin, vmax

fig, ax = plt.subplots()
ax.plot([-29, 31], [-29, 31])

ax.xaxis.set_major_locator(MyLocator())
ax.yaxis.set_major_locator(MyLocator())
ax.autoscale()

plt.show()
get_data_interval 就是我在寻找的。谢谢! - Pygmalion要将轴的xlim设置为数据的确切范围,请使用ax.xlim()方法与内置的min()和max()函数相结合:
#x could be a list like [0,3,5,6,15]
ax = plt.gca()
ax.xlim([min(x), max(x)]) # evaluates to ax.xlim([0, 15]) with example data above
当你知道你需要它是5的倍数时,根据数据的x范围修改限制条件:
import math
import matplotlib.pyplot as pet
#your plotting here
xmin = min( <data_x> )
xmax = max( <data_x> )
ax = plt.gca()
ax.set_xlim( [5*math.floor(xmin/5.0), 5*math.ceil(xmax/5.0)]  )
5.0,因为int/int会忽略小数部分。例如,在5*math.ceil(6/5)中,xmax=6将返回5,这会截断您的数据,而5*math.ceil(6/5.0)会给出所需的5*math.ceil(1.2) = 5*2 =10。
axis函数。 - tglaria