使用Numpy将VTK转换为Matplotlib

13
我想从一个VTK文件中提取一些数据(例如标量),并获取它们在网格上的坐标,然后在Matplotlib中处理。问题是我不知道如何通过名称获取VTK文件中的点/单元格数据(例如给定标量名称),并使用vtk_to_numpy将它们加载到numpy数组中。
我的代码应该像这样:
import matplotlib.pyplot as plt
from scipy.interpolate import griddata
import numpy as np
from vtk import *
from vtk.util.numpy_support import vtk_to_numpy

# load input data
reader = vtk.vtkXMLUnstructuredGridReader()
reader.SetFileName("my_input_data.vtk")
reader.Update()

(...missing steps)

# VTK to Numpy
my_numpy_array = vtk_to_numpy(...arguments ?)

#Numpy to Matplotlib (after converting my_numpy_array to x,y and z)
CS = plt.contour(x,y,z,NbLevels)
...

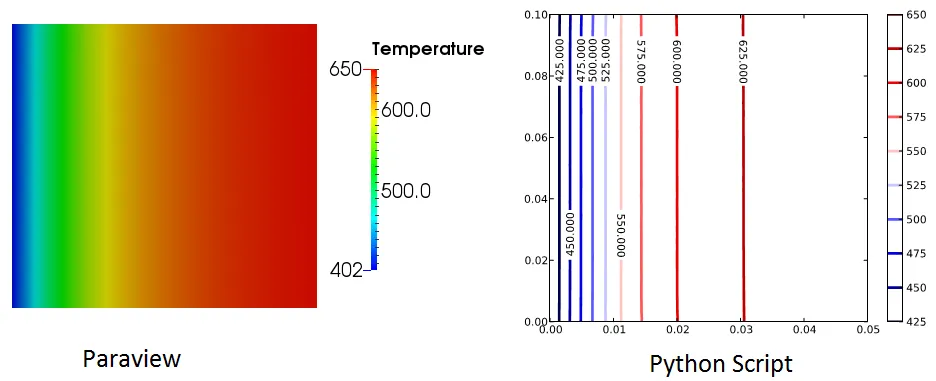
PS: 我知道Paraview可以完成这个任务,但我想在不打开Paraview的情况下后处理一些数据。非常感谢任何帮助。

编辑1

我发现这个pdf教程在学习处理VTK文件的基础知识方面非常有用。


vtk_to_numpy 的文档对此有何说明? - tacaswell
2个回答

11

我终于想到一种方法(可能不是最优的),可以完成这项工作。这里的例子是从一个vtk文件中提取温度场并进行等值线绘图:

import matplotlib.pyplot as plt
import matplotlib.cm as cm
from scipy.interpolate import griddata
import numpy as np
import vtk
from vtk.util.numpy_support import vtk_to_numpy

# load a vtk file as input
reader = vtk.vtkXMLUnstructuredGridReader()
reader.SetFileName("my_input_data.vtk")
reader.Update()

# Get the coordinates of nodes in the mesh
nodes_vtk_array= reader.GetOutput().GetPoints().GetData()

#The "Temperature" field is the third scalar in my vtk file
temperature_vtk_array = reader.GetOutput().GetPointData().GetArray(3)

#Get the coordinates of the nodes and their temperatures
nodes_nummpy_array = vtk_to_numpy(nodes_vtk_array)
x,y,z= nodes_nummpy_array[:,0] , nodes_nummpy_array[:,1] , nodes_nummpy_array[:,2]

temperature_numpy_array = vtk_to_numpy(temperature_vtk_array)
T = temperature_numpy_array

#Draw contours
npts = 100
xmin, xmax = min(x), max(x)
ymin, ymax = min(y), max(y)

# define grid
xi = np.linspace(xmin, xmax, npts)
yi = np.linspace(ymin, ymax, npts)
# grid the data
Ti = griddata((x, y), T, (xi[None,:], yi[:,None]), method='cubic')  

## CONTOUR: draws the boundaries of the isosurfaces
CS = plt.contour(xi,yi,Ti,10,linewidths=3,cmap=cm.jet) 

## CONTOUR ANNOTATION: puts a value label
plt.clabel(CS, inline=1,inline_spacing= 3, fontsize=12, colors='k', use_clabeltext=1)

plt.colorbar() 
plt.show() 

enter image description here


1
我收到了 NameError: name 'cm' is not defined 的错误。 - sigvaldm
@sigvaldm,缺少了一行导入语句,我更新了答案并添加了import matplotlib.cm as cm - SAAD
啊,我明白了。我肯定在某个时候已经弄清楚了,因为我之前受到这篇文章的启发做了一些图表。谢谢! - sigvaldm
Matplotlib有一个API,可以将非结构化数据插值到三角形网格上。 - jadelord

7

我不知道你的数据集具体是什么样子,但是这里提供了一些方法来获取点的位置和标量值:

from vtk import *
from vtk.util.numpy_support import vtk_to_numpy

# load input data
reader = vtk.vtkGenericDataObjectReader()
reader.SetFileName(r"C:\Python27\VTKData\Data\uGridEx.vtk")
reader.Update()
ug  = reader.GetOutput()
points = ug.GetPoints()
print vtk_to_numpy(points.GetData())
print vtk_to_numpy(ug.GetPointData().GetScalars())

如果您能使用tvtk,那么这将会变得更加容易:

from tvtk.api import tvtk
reader = tvtk.GenericDataObjectReader()
reader.file_name = r"C:\Python27\VTKData\Data\uGridEx.vtk"
reader.update()
ug = reader.output
print ug.points.data.to_array()
print ug.point_data.scalars.to_array()

如果你想在matplotlib中绘制轮廓图(contour plot),我认为你需要一个网格(grid),你可能需要使用一些VTK类将数据集转换为网格,比如vtkProbeFilter


网页内容由stack overflow 提供, 点击上面的
可以查看英文原文,
原文链接