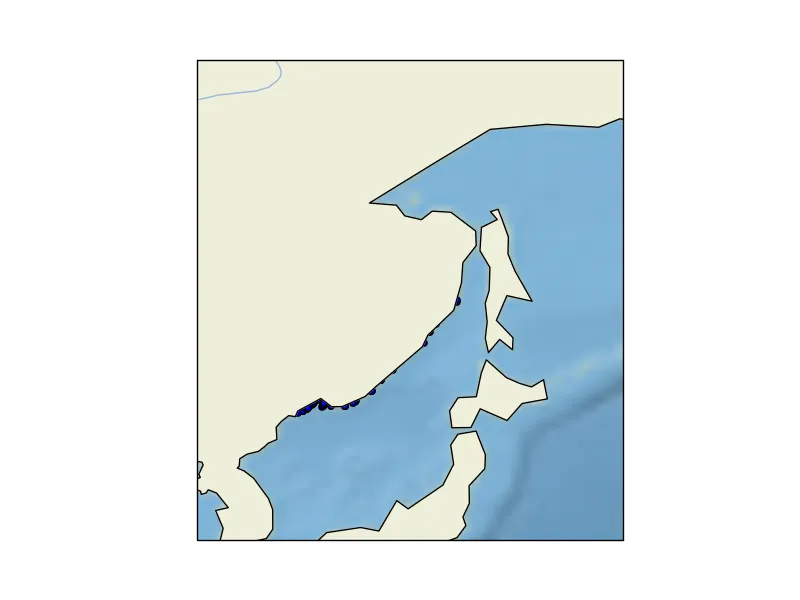
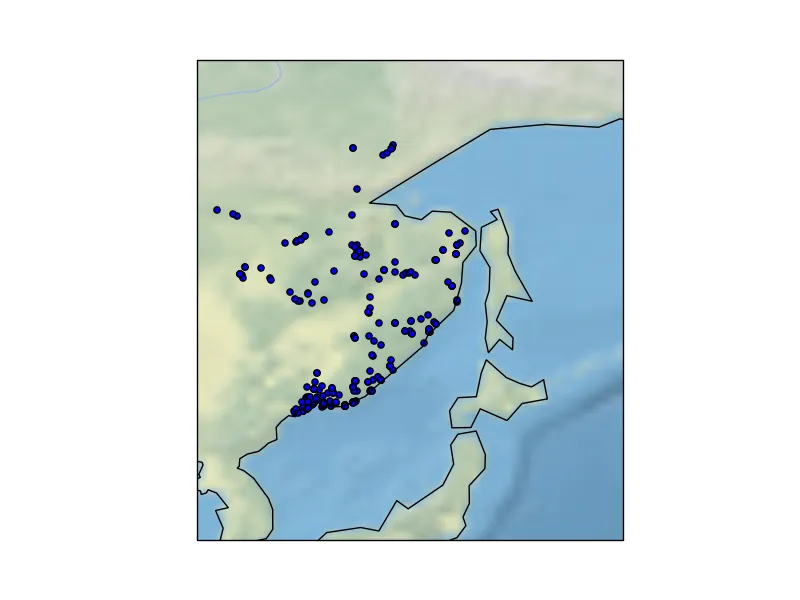
我正在尝试使用Cartopy(见下方代码)在地图上绘制多个点的位置(散点图)。当我尝试渲染图表时,数据点被呈现在LAND层后面。但是我想在LAND层上绘制我的散点数据...我做错了什么?
Cartopy版本:0.12.x,Matplotlib版本:1.4.2
import matplotlib.pyplot as plt
import cartopy.crs as ccrs
import cartopy.feature as cfeature

ax = plt.axes(projection=ccrs.PlateCarree())
ax.set_extent([125, 150, 35, 63])

ax.stock_img()

ax.add_feature(cfeature.LAND) #If I comment this => all ok, but I need
ax.add_feature(cfeature.LAKES)
ax.add_feature(cfeature.RIVERS)
ax.coastlines()

ax.scatter(yc,xc,transform=ccrs.PlateCarree()) #yc, xc -- lists or numpy arrays

plt.show()