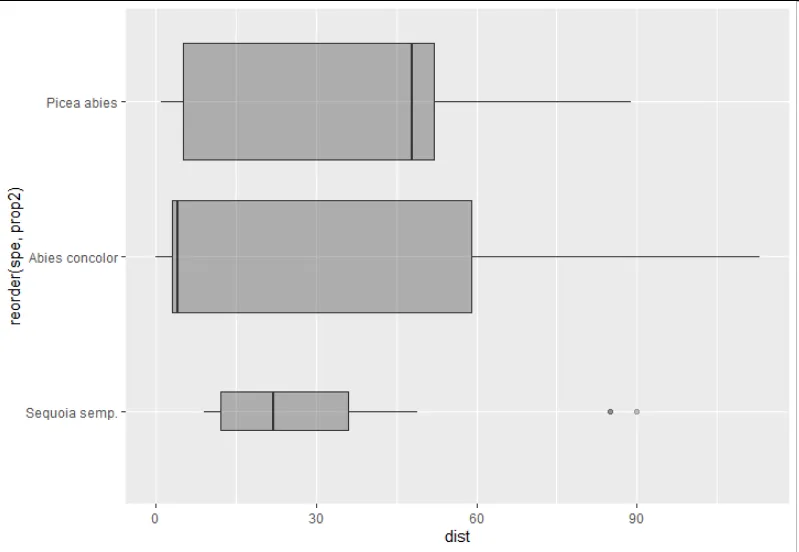
ggplot2:如何根据另一个变量更改箱线图的宽度?

3
我创建了一个箱线图,展示了一些物种$spe的分散距离$dist,我希望箱子的宽度与这些物种再生密度成比例。我使用了"varwidth"和权重美学,如下所示,但仍然不正确,因为它仅与观测数量成比例,而不是与再生密度成比例...
(对于密度,我计算了每个物种的比例,因此从10到100。它在列data_dist2$prop2中给出。)
p <- ggplot(data_dist2, aes(x = reorder(spe, prop2), y = dist)) + 
  coord_flip() + 
  geom_boxplot(varwidth = TRUE, alpha=0.3, aes(weight=data_dist2$prop2), fill='grey10')

请问您是否有任何想法如何使箱线图完全与我的 prop2 列成比例?

示例:

structure(list(spe = structure(c(1L, 1L, 1L, 1L, 1L, 1L, 1L, 
1L, 1L, 1L, 1L, 3L, 3L, 3L, 3L, 3L, 3L, 3L, 3L, 3L, 3L, 3L, 3L, 
3L, 3L, 3L, 3L, 2L, 2L, 2L, 2L, 2L, 2L, 2L, 2L, 2L, 2L, 2L, 2L, 
2L), .Label = c("Abies concolor", "Picea abies", "Sequoia semp."
), class = "factor"), dist = c(0, 0, 3, 3, 4, 4, 25, 46, 59, 
113, 113, 9, 12, 12, 12, 15, 22, 22, 22, 22, 35, 35, 36, 49, 
85, 85, 90, 5, 5, 1, 1, 8, 13, 48, 48, 52, 52, 52, 65, 89), prop2 = c(92.17, 
92.17, 92.17, 92.17, 92.17, 92.17, 92.17, 92.17, 92.17, 92.17, 
92.17, 10.9, 10.9, 10.9, 10.9, 10.9, 10.9, 10.9, 10.9, 10.9, 
10.9, 10.9, 10.9, 10.9, 10.9, 10.9, 10.9, 100, 100, 100, 100, 
100, 100, 100, 100, 100, 100, 100, 100, 100)), row.names = c(NA, 
-40L), class = "data.frame")


如果 prop2 的范围在10到100之间,您可以设置 aes(width = I(prop2 / 100))。这将把宽度设置为从0.1到1。 - Drumy
你好@Drumy,感谢你的回答。你把宽度美学放在哪里?我收到了这个错误信息:警告:忽略未知的美学:宽度。 - Aurore F
哎呀,我以为 geom_boxplot 接受 width 作为美学参数。我的错。解决方案比那复杂一点。请看下面的答案。 - Drumy
2个回答

0

Weight似乎并不是为此设计的,但您可以稍微修改一下。首先请注意,给定每个组的权重是观察值的权重之和,因此如果每个物种的观察次数不同,则可能需要将prop2更改为当前值除以该组中的观察次数。(从您的示例中无法确定是否适用于此)

然后请注意,宽度与权重的平方根成比例,因此请使用以下代码将其反转:

p <- ggplot(data_dist2, aes(x = reorder(spe, prop2), y = dist)) + 
     coord_flip() + 
     geom_boxplot(varwidth = TRUE, alpha=0.3, aes(weight=data_dist2$prop2^2), fill='grey10')

0
Miff 比我先回答了,但无论如何这是我的答案。正如 Miff 所说,您可以通过您的 prop2 来加权宽度。
ggplot(data_dist2, aes(x = reorder(spe, prop2), y = dist)) + 
 geom_boxplot(aes(weight = prop2), 
              varwidth = TRUE,
              fill='grey10', alpha=0.3) +
 coord_flip()

enter image description here

但是geom_boxplot()隐式地考虑了样本大小。因此,您需要在权重中除去它。以下是您可以使用data.table完成的方法。

library(data.table)
setDT(data_dist2) # convert to data.table
data_dist2[, weight := prop2 / .N, by = spe] # Divide prop2 by sample size for each species

ggplot(data_dist2, aes(x = reorder(spe, prop2), y = dist)) + 
  geom_boxplot(aes(weight = weight),  # note weight = weight, not weight = prop2
               varwidth = TRUE,
               fill='grey10', alpha=0.3) +
  coord_flip()

enter image description here


谢谢,我尝试了@Miff下面提供的方法。看起来很清楚,但是当我将其应用于所有物种时,仍然没有得到好的结果。我还尝试创建一个新列,其中包含观察次数(w)的平方根,因此我可以使用weight=prop2/w来“取消”观察次数给出的权重。但它仍然不像应该的样子...我必须去开会,但我会在会后立即再试一次并让您知道! - Aurore F

网页内容由stack overflow 提供, 点击上面的
可以查看英文原文,
原文链接