如何使用CSS3/HTML5创建一个切片圆形?

3
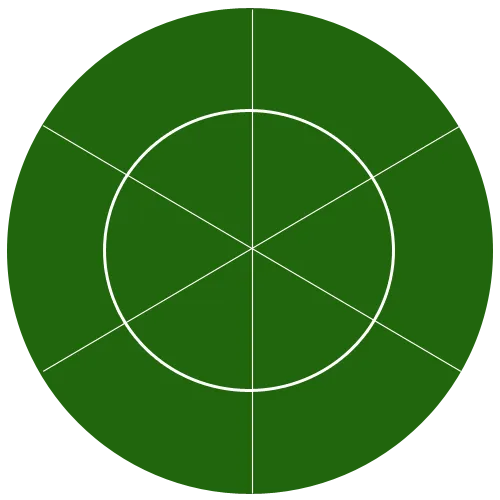
请帮我创建一个切片圆形,我可以在每个切片上单击以给出不同的命令,就像我们在按钮中所做的那样。 切片必须如下所示:
  • 2个圆,主外圆,内圆(大小为外圆的一半)

  • 3条线跨越主圆,将2个圆分成12个切片。 这三条线的直线应该是垂直线。

参考图片:

circle with slices

.maincircle {
  height: 404px;
  width: 404px;
}

.slice1 {
  float: left;
  height: 200px;
  width: 200px;
  border: 1px solid #000;
  background-color: #093;
  cursor: pointer;
  border-radius: 190px 0 0 0;
  -moz-border-radius: 190px 0 0 0;
  -webkit-border-radius: 190px 0 0 0;
}

.slice1:hover {
  background-color: #6C6;
}

.slice2 {
  float: left;
  height: 200px;
  width: 200px;
  border: 1px solid #000;
  background-color: #093;
  cursor: pointer;
  -moz-border-radius: 0 190px 0 0;
  -webkit-border-radius: 0 190px 0 0;
}

.slice2:hover {
  background-color: #6C6;
}

.slice3 {
  float: left;
  height: 200px;
  width: 200px;
  border: 1px solid #000;
  background-color: #093;
  cursor: pointer;
  -moz-border-radius: 0 0 0 190px;
  -webkit-border-radius: 0 0 0 190px;
}

.slice3:hover {
  background-color: #6C6;
}

.slice4 {
  float: left;
  height: 200px;
  width: 200px;
  border: 1px solid #000;
  background-color: #093;
  cursor: pointer;
  -moz-border-radius: 0 0 190px 0;
  -webkit-border-radius: 0 0 190px 0;
}

.slice4:hover {
  background-color: #6C6;
}
<div class="maincircle">
  <div class="slice1"></div>
  <div class="slice2"></div>
  <div class="slice3"></div>
  <div class="slice4"></div>
</div>


3
请查看 <svg> 或者 <canvas> 元素。如果您不需要添加复杂的动画,那么 <svg> 是最好的选择。 - Mooseman
1
可能是使用CSS3在圆中创建分段的重复问题。 - Zach Saucier
我只能做到使用4个div的水平,其中只有4个切片。 - Dilukshan Mahendra
2个回答

7
这里是我会采取的方法的一个快速示例。
演示:http://jsfiddle.net/kevinPHPkevin/XN3ZB/314/ 我使用 http://code.highcharts.com/highcharts.js 这种工具来实现这样的事情。这意味着使用饼图,您可以根据需要进行样式设置,并使它们按照您的喜好运作。这非常快速和简单。
编辑为:
修改为多层。

$(document).ready(function() {
  Highcharts.setOptions({
    colors: ['#2a6705']
  });

  RenderPieChart('container', [
    ['one piece', 15.6],
    ['one piece', 15.6],
    ['one piece', 15.6],
    ['one piece', 15.6],
    ['one piece', 15.6],
    ['one piece', 15.6],
  ]);

  function RenderPieChart(elementId, dataList) {
    new Highcharts.Chart({
      chart: {
        renderTo: elementId,
        plotBackgroundColor: null,
        plotBorderWidth: null,
        plotShadow: false
      },
      title: {
        text: 'Use a pie chart for more than just data'
      },
      tooltip: {
        formatter: function() {

          return '<b> Add an event here</b>';

        }
      },
      plotOptions: {
        pie: {
          allowPointSelect: true,
          cursor: 'pointer',
          dataLabels: {
            enabled: true,
            color: '#000000',
            connectorColor: '#000000',
            formatter: function() {
              return '<b>Make these clickable</b>';
            }
          }
        }
      },
      series: [{
        type: 'pie',
        name: 'Browser share',
        data: dataList
      }, {
        type: 'pie',
        name: 'Browser share',
        data: dataList,
        innerSize: '70%'
      }]
    });
  };
});
<script src="https://ajax.googleapis.com/ajax/libs/jquery/1.6.4/jquery.min.js"></script>
<script src="https://code.highcharts.com/highcharts.js"></script>
<script src="https://code.highcharts.com/modules/exporting.js"></script>

<div id="container" style="min-width: 400px; height: 400px; margin: 0 auto"></div>


1
如果您不需要交互式的内容,只需要可点击的内容,我建议使用带有 html 图像映射的图像。 - Kevin Lynch

5

我觉得这很有趣,所以我就在SVG中创建了它:

path:hover {
  fill: blue;
}
<svg height="440px" width="440px">
  <path d="M 220 220 L 270 306.60254037844385 A 100 100 0 0 0 320 220 z" fill="green" stroke="white" onclick="alert('inner-0')" />
  <path d="M 420 220 A 200 200 0 0 1 320 393.2050807568877  L 270 306.60254037844385 A 100 100 0 0 0 320 220  z" fill="green" stroke="white" onclick="alert('outer-0')" />
  <path d="M 220 220 L 170.00000000000003 306.6025403784439 A 100 100 0 0 0 270 306.60254037844385 z" fill="green" stroke="white" onclick="alert('inner-1')" />
  <path d="M 320 393.2050807568877 A 200 200 0 0 1 120.00000000000004 393.20508075688775  L 170.00000000000003 306.6025403784439 A 100 100 0 0 0 270 306.60254037844385  z" fill="green" stroke="white" onclick="alert('outer-1')" />
  <path d="M 220 220 L 120 220 A 100 100 0 0 0 170.00000000000003 306.6025403784439 z" fill="green" stroke="white" onclick="alert('inner-2')" />
  <path d="M 120.00000000000004 393.20508075688775 A 200 200 0 0 1 20 220.00000000000003  L 120 220 A 100 100 0 0 0 170.00000000000003 306.6025403784439  z" fill="green" stroke="white" onclick="alert('outer-2')" />
  <path d="M 220 220 L 169.99999999999994 133.39745962155615 A 100 100 0 0 0 120 220 z" fill="green" stroke="white" onclick="alert('inner-3')" />
  <path d="M 20 220.00000000000003 A 200 200 0 0 1 119.99999999999991 46.79491924311233  L 169.99999999999994 133.39745962155615 A 100 100 0 0 0 120 220  z" fill="green" stroke="white" onclick="alert('outer-3')" />
  <path d="M 220 220 L 269.99999999999994 133.3974596215561 A 100 100 0 0 0 169.99999999999994 133.39745962155615 z" fill="green" stroke="white" onclick="alert('inner-4')" />
  <path d="M 119.99999999999991 46.79491924311233 A 200 200 0 0 1 319.9999999999999 46.79491924311219  L 269.99999999999994 133.3974596215561 A 100 100 0 0 0 169.99999999999994 133.39745962155615  z" fill="green" stroke="white" onclick="alert('outer-4')"
  />
  <path d="M 220 220 L 320 219.99999999999997 A 100 100 0 0 0 269.99999999999994 133.3974596215561 z" fill="green" stroke="white" onclick="alert('inner-5')" />
  <path d="M 319.9999999999999 46.79491924311219 A 200 200 0 0 1 420 219.99999999999994  L 320 219.99999999999997 A 100 100 0 0 0 269.99999999999994 133.3974596215561  z" fill="green" stroke="white" onclick="alert('outer-5')" />
</svg>

如果有人感兴趣,我是用以下(丑陋的)代码生成的:

http://jsfiddle.net/u2h4J/2/

var RADIUS = 200;
var PADDING = 20;
var SLICES = 6;

var svg = "";

for (var i = 0; i < SLICES; i++) {
  var p1 = {
    x: Math.cos(Math.PI * 2 / SLICES * i) * RADIUS + RADIUS + PADDING,
    y: Math.sin(Math.PI * 2 / SLICES * i) * RADIUS + RADIUS + PADDING
  };

  var p2 = {
    x: Math.cos(Math.PI * 2 / SLICES * (i + 1)) * RADIUS + RADIUS + PADDING,
    y: Math.sin(Math.PI * 2 / SLICES * (i + 1)) * RADIUS + RADIUS + PADDING
  };

  var p4 = {
    x: Math.cos(Math.PI * 2 / SLICES * i) * (RADIUS / 2) + RADIUS + PADDING,
    y: Math.sin(Math.PI * 2 / SLICES * i) * (RADIUS / 2) + RADIUS + PADDING
  };

  var p3 = {
    x: Math.cos(Math.PI * 2 / SLICES * (i + 1)) * (RADIUS / 2) + RADIUS + PADDING,
    y: Math.sin(Math.PI * 2 / SLICES * (i + 1)) * (RADIUS / 2) + RADIUS + PADDING
  };


  svg += "<path d='M " + (RADIUS + PADDING) + " " + (RADIUS + PADDING) + " L " + p3.x + " " + p3.y + " A " + (RADIUS / 2) + " " + (RADIUS / 2) + " 0 0 0 " + p4.x + " " + p4.y + " z' fill='green' stroke='white' onclick='alert(\"inner-" + i + "\")'/>";

  svg += "<path d='M " + p1.x + " " + p1.y + " A " + RADIUS + " " + RADIUS + " 0 0 1 " + p2.x + " " + p2.y + "  L " + p3.x + " " + p3.y + " A " + RADIUS / 2 + " " + RADIUS / 2 + " 0 0 0 " + p4.x + " " + p4.y + "  z' fill='green' stroke='white' onclick='alert(\"outer-" + i + "\")'/>";
}

svg = "<svg height='" + (RADIUS * 2 + PADDING * 2) + "px' width='" + (RADIUS * 2 + PADDING * 2) + "px'>" + svg + "</svg>";

$("body").append(svg);
<script src="https://ajax.googleapis.com/ajax/libs/jquery/1.10.1/jquery.min.js"></script>

http://jsfiddle.net/t3pLn/1/


@James:我对SVG不太熟悉,但很喜欢你切割圆形的想法。是否可以在每个切片上放置文本?我正在尝试实现2或3级组织结构图。父级在中心即最内层圆圈,其子级围绕其周围,并且当单击子级时,该子级将成为父级,外部圆圈将有其子级。 - JDev
@JDev 你可以在 SVG 上放置文本。看一下 <text> 元素。不幸的是,SVG 中的文本没有换行等功能,因此如果文本是动态的,则可能会有些棘手。 - James Montagne
哦。文本将针对每个节点具有动态性。 - JDev

网页内容由stack overflow 提供, 点击上面的
可以查看英文原文,
原文链接