9个回答
13
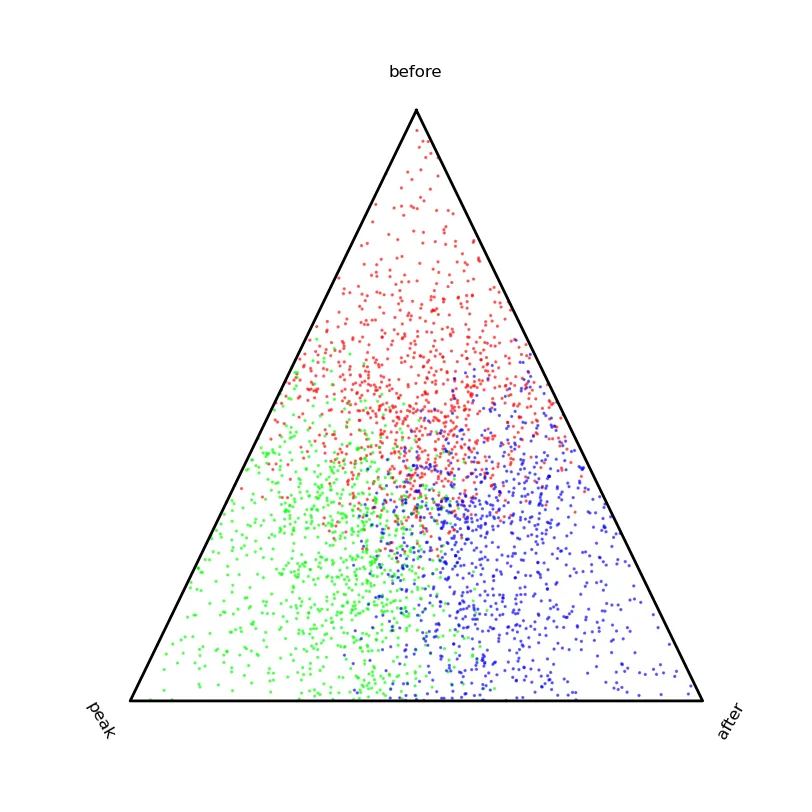
创建了一个生成三元(或更高维度)图的基本脚本。没有网格线或刻度线,但使用“基础”数组中的向量很容易添加这些功能。
from pylab import *


def ternaryPlot(
            data,

            # Scale data for ternary plot (i.e. a + b + c = 1)
            scaling=True,

            # Direction of first vertex.
            start_angle=90,

            # Orient labels perpendicular to vertices.
            rotate_labels=True,

            # Labels for vertices.
            labels=('one','two','three'),

            # Can accomodate more than 3 dimensions if desired.
            sides=3,

            # Offset for label from vertex (percent of distance from origin).
            label_offset=0.10,

            # Any matplotlib keyword args for plots.
            edge_args={'color':'black','linewidth':2},

            # Any matplotlib keyword args for figures.
            fig_args = {'figsize':(8,8),'facecolor':'white','edgecolor':'white'},
        ):
    '''
    This will create a basic "ternary" plot (or quaternary, etc.)
    '''
    basis = array(
                    [
                        [
                            cos(2*_*pi/sides + start_angle*pi/180),
                            sin(2*_*pi/sides + start_angle*pi/180)
                        ]
                        for _ in range(sides)
                    ]
                )

    # If data is Nxsides, newdata is Nx2.
    if scaling:
        # Scales data for you.
        newdata = dot((data.T / data.sum(-1)).T,basis)
    else:
        # Assumes data already sums to 1.
        newdata = dot(data,basis)

    fig = figure(**fig_args)
    ax = fig.add_subplot(111)

    for i,l in enumerate(labels):
        if i >= sides:
            break
        x = basis[i,0]
        y = basis[i,1]
        if rotate_labels:
            angle = 180*arctan(y/x)/pi + 90
            if angle > 90 and angle <= 270:
                angle = mod(angle + 180,360)
        else:
            angle = 0
        ax.text(
                x*(1 + label_offset),
                y*(1 + label_offset),
                l,
                horizontalalignment='center',
                verticalalignment='center',
                rotation=angle
            )

    # Clear normal matplotlib axes graphics.
    ax.set_xticks(())
    ax.set_yticks(())
    ax.set_frame_on(False)

    # Plot border
    ax.plot(
        [basis[_,0] for _ in range(sides) + [0,]],
        [basis[_,1] for _ in range(sides) + [0,]],
        **edge_args
    )

    return newdata,ax


if __name__ == '__main__':
    k = 0.5
    s = 1000

    data = vstack((
        array([k,0,0]) + rand(s,3),
        array([0,k,0]) + rand(s,3),
        array([0,0,k]) + rand(s,3)
    ))
    color = array([[1,0,0]]*s + [[0,1,0]]*s + [[0,0,1]]*s)

    newdata,ax = ternaryPlot(data)

    ax.scatter(
        newdata[:,0],
        newdata[:,1],
        s=2,
        alpha=0.5,
        color=color
        )
    show()
- dave
7
R有一个名为VCD的外部包,应该可以满足您的需求。
文档非常好(与该包一起分发的122页手册);还有一本同名书籍,作者是该包的作者(Michael Friendly教授)。
要使用vcd创建三元图,只需调用ternaryplot()并传入一个m x 3矩阵,即一个具有三列的矩阵。
方法签名非常简单;仅需要一个参数(m x 3数据矩阵),所有关键字参数都与绘图的美学相关,除了scale,当设置为1时,按列归一化数据。
要在三元图上绘制数据点,给定点的坐标被计算为每个构成数据矩阵的特征值是单独的权重的质心点,因此点V(a,b,c)的坐标为
V(b, c/2, c * (3^.5)/2
为了生成下面的图表,我创建了一些假数据来表示四种不同的化学混合物,每种混合物由三种物质(x、y、z)的不同分数组成。我对输入进行了缩放(因此 x+y+z=1),但如果您向函数传递其“scale”参数的值,它将为您执行缩放(实际上,默认值为1,我认为这是您问题所需的)。我使用不同的颜色和符号来表示四个数据点,但您也可以只使用单一的颜色/符号并通过“id”参数标记每个点。
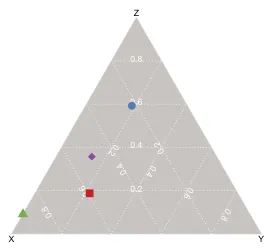
- doug
3
看起来确实很有趣,可惜它有太多依赖项,而我在我的 Fedora 12 机器上没有这些依赖项 :-( 不管怎样,谢谢你的回答,我给你点个赞。 - Cristian Ciupitu
1真遗憾——我认为你本来会喜欢使用那个库的。 (很巧合的是,当我在上面回答时,我正在布加勒斯特机场,从美丽的法加拉什山脉攀登旅行回西班牙。)我不认为我有足够的声望来向您的问题添加“r”标签,所以如果您同意,也许可以在有机会时添加该标签。 - doug
我通过运行R并在R提示符下键入
install.packages(c("vcd"))成功地将其安装在Fedora 12上。此外,来自ternaryplot手册页面的示例非常好用。再次感谢!至于r标签,我没有注意到您的评论,否则我会自己添加的。附言:我很高兴您喜欢攀岩之旅。 - Cristian Ciupitu6
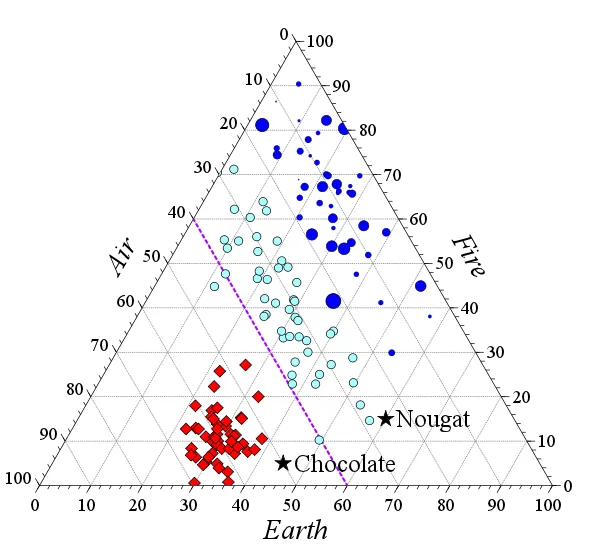
我在R中编写的一个软件包刚刚被CRAN接受了,网页链接为www.ggtern.com:
它是基于ggplot2构建的,我将其作为平台使用。我的驱动力是希望我的工作具有一致性,由于我经常使用ggplot2,因此开发这个软件包是一个逻辑上的进展。
对于那些使用ggplot2的人来说,使用ggtern应该很容易,并且以下是一些可以实现的演示。
等高线图也已经适用于三元环境,并且通过Mahalanobis距离的新几何形式来表示置信区间。
它是基于ggplot2构建的,我将其作为平台使用。我的驱动力是希望我的工作具有一致性,由于我经常使用ggplot2,因此开发这个软件包是一个逻辑上的进展。
对于那些使用ggplot2的人来说,使用ggtern应该很容易,并且以下是一些可以实现的演示。
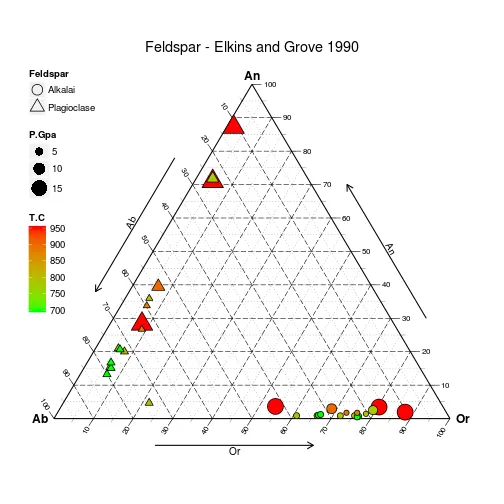
使用以下代码生成:
# Load data
data(Feldspar)

# Sort it by decreasing pressure
# (so small grobs sit on top of large grobs
Feldspar <- Feldspar[with(Feldspar, order(-P.Gpa)), ]

# Build and Render the Plot
ggtern(data = Feldspar, aes(x = An, y = Ab, z = Or)) +
#the layer
geom_point(aes(fill = T.C,
               size = P.Gpa,
               shape = Feldspar)) +
#scales
scale_shape_manual(values = c(21, 24)) +
scale_size_continuous(range = c(2.5, 7.5)) +
scale_fill_gradient(low = "green", high = "red") +

#theme tweaks
theme_tern_bw()  +
theme(legend.position      = c(0, 1),
      legend.justification = c(0, 1),
      legend.box.just      = "left") +

#tweak guides
guides(shape= guide_legend(order   =1,
                           override.aes=list(size=5)),
       size = guide_legend(order   =2),
       fill = guide_colourbar(order=3)) +

#labels and title
labs(size = "Pressure/GPa",
     fill = "Temperature/C") +
ggtitle("Feldspar - Elkins and Grove 1990")
等高线图也已经适用于三元环境,并且通过Mahalanobis距离的新几何形式来表示置信区间。
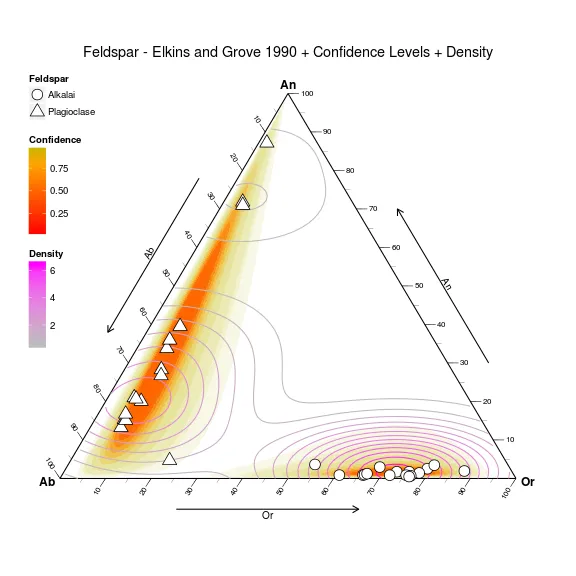
使用以下代码生成:
ggtern(data=Feldspar,aes(An,Ab,Or)) +
  geom_confidence(aes(group=Feldspar,
                      fill=..level..,
                      alpha=1-..level..),
                      n=2000,
                  breaks=c(0.01,0.02,0.03,0.04,
                           seq(0.05,0.95,by=0.1),
                           0.99,0.995,0.9995),
                  color=NA,linetype=1) +
  geom_density2d(aes(color=..level..)) +
  geom_point(fill="white",aes(shape=Feldspar),size=5) +
  theme_tern_bw() +
  theme_tern_nogrid() +
  theme(ternary.options=element_ternary(padding=0.2),
                        legend.position=c(0,1),
                        legend.justification=c(0,1),
                        legend.box.just="left") +
  labs(color="Density",fill="Confidence",
   title="Feldspar - Elkins and Grove 1990 + Confidence Levels + Density") +
  scale_color_gradient(low="gray",high="magenta") +
  scale_fill_gradient2(low="red",mid="orange",high="green",
                       midpoint=0.8) +
  scale_shape_manual(values=c(21,24)) +
  guides(shape= guide_legend(order   =1,
                             override.aes=list(size=5)),
         size = guide_legend(order   =2),
         fill = guide_colourbar(order=3),
         color= guide_colourbar(order=4),
         alpha= "none")
- Nicholas Hamilton
3
Chloë Lewis使用Python和Matplotlib开发了一个三角图常规类,旨在支持土壤质地三角形。该项目可在此处获得:https://github.com/chlewissoil/TernaryPlotPy。Chloe编辑补充:将其移至更可靠的主机!此外,它是一个公共库,因此如果您想请求库化,可以添加一个问题。希望对某人有用。
- Frédéric Grosshans
1
很好的图表和+1。可惜这段代码不够通用,不能作为库使用。 - Cristian Ciupitu
1
我刚刚发现了一个使用Python/Matplotlib生成三元图的工具,名为wxTernary。它可以通过http://wxternary.sourceforge.net/获取--我第一次尝试就成功地生成了一个三元图。
- Deaton
1
项目似乎没有在源代码管理工具(SCM)中提交脚本 :( - oDDsKooL
-1
如果找不到更简单的方法,就找一个矢量绘图库来自己制作。
- CookieOfFortune
1
我也考虑过这个问题,但是涉及的工作量太大了(呼噜声)。有许多细节需要解决,例如轴标签或刻度线的位置。顺便说一句,Phil的解决方案基本上是从头开始绘制图形。 - Cristian Ciupitu
网页内容由stack overflow 提供, 点击上面的可以查看英文原文,
原文链接
原文链接
library(sos); findFn("{ternary plot}")。 - Ben Bolker