问题: 使用Python库'plotnine',能否绘制交互式的3D表面图?
备用说明
What I'd like to do is, under python environment, creating an interactive 3D plot with R plot grammars like we do with ggplot2 library in R. It's because I have hard time remembering grammars of matplotlib and other libraries like seaborn.
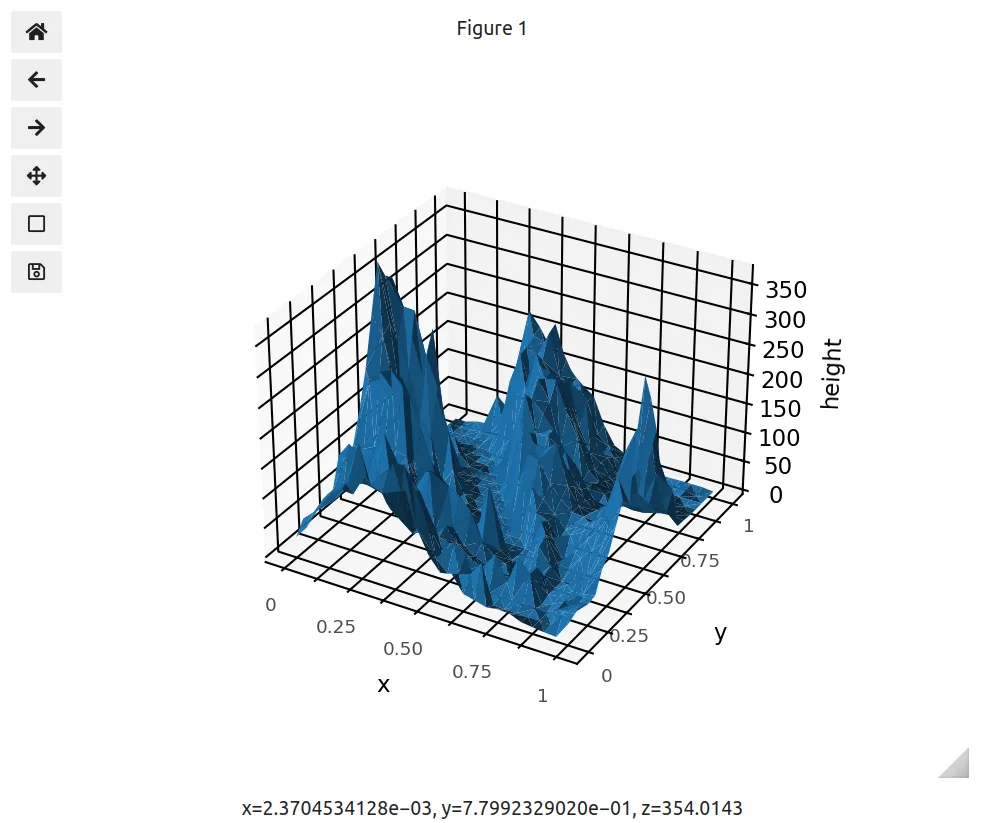
An interactive 3D plot means a 3D plot that you can zoom in, zoom out, and scroll up and down, etc.
It seems like only Java supported plotting libraries scuh as bokeh or plotly can create interactive 3D plots. But I want to create it with the library 'plotnine' because the library supports ggplot-like grammar, which is easy to remember.
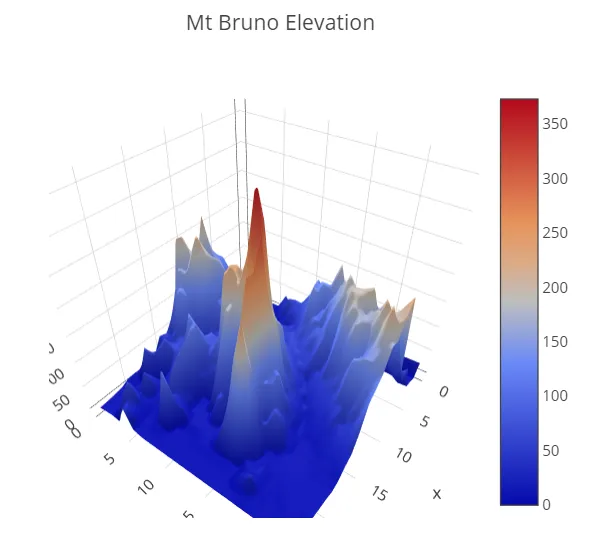
For example, can I draw a 3D surface plot like the one below with the library 'plotnine'?
import plotly.plotly as py
import plotly.graph_objs as go
import pandas as pd

# Read data from a csv
z_data =
pd.read_csv('https://raw.githubusercontent.com/plotly/datasets/
master/api_docs/mt_bruno_elevation.csv')

 data = [
        go.Surface(
        z=z_data.as_matrix()
        )]
 layout = go.Layout(
 title='Mt Bruno Elevation',
 autosize=False,
 width=500,
 height=500,
 margin=dict(
 l=65,
 r=50,
 b=65,
 t=90
   )
 )
 fig = go.Figure(data=data, layout=layout)
 py.iplot(fig, filename='elevations-3d-surface')
附:如果我可以用类似ggplot语法绘制交互式3D图,我们不必使用'plotnine'库。
感谢您抽出时间阅读此问题!
<ggplot: (8742175882381)>字符串,您可以将 ggplot 包装在print中或后缀为;(但是;似乎只在 JupyterLab 中有效?)。 - krassowski