我想使用R的plotly库创建一个三维表面图,显示x、y和z坐标数据,类似于下面链接中所示的内容:
https://plot.ly/r/3d-surface-plots/
从链接的示例中可以看出,plot_ly函数需要将z坐标放在一个维度为x * y的矩阵中,就像在datasets::volcano中看到的那样。我希望得到一些关于如何构建这个矩阵的指导。下面是我的样本x,y坐标数据:
## x coordinates
xSeq = seq(0, 1, .01)
## y coordinates
ySeq = seq(0, 1, .01)
## list with x, y coordinates
exmplList = list(x = xSeq, y = ySeq)
通过一个公式从x,y对中计算z坐标(这里使用的示例公式是x + y)。我尝试过类似于以下的东西:
exmplList = within(exmplList, z <- matrix(x + y, nrow = length(xSeq), ncol = length(ySeq)))
但这并不能实现我想要达到的配对组合。
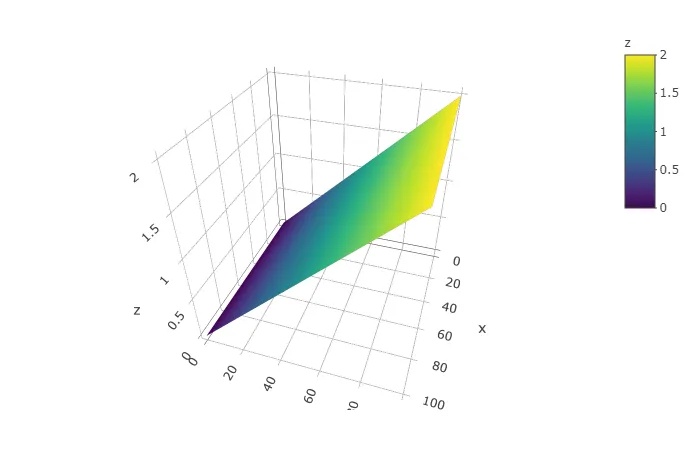
z <- outer(xSeq, ySeq, "+")- Stéphane Laurent