我一直在尝试在一个 y 轴上绘制两个变量。这是我的代码:
set.seed(20)
x1=rnorm(100)
x2=rnorm(100)
x3=rnorm(100)
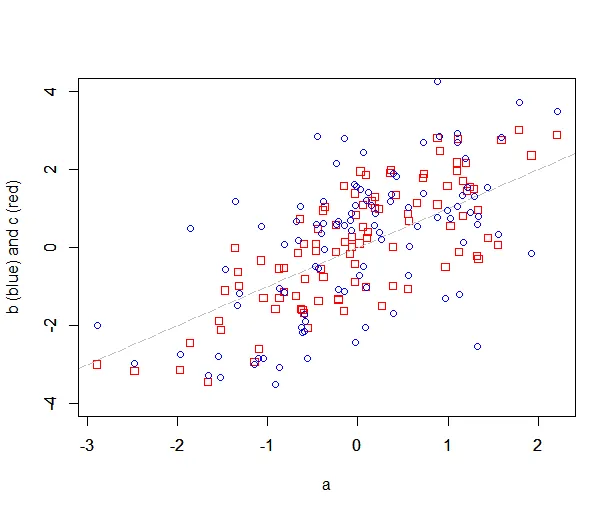
t=data.frame(a=x1,b=x1+x2,c=x1+x2+x3)
plot(t$a,t$b,xlab="",ylab="",pch=0,col="red")
par(new=TRUE)
plot(t$a,t$c,xlab="a",ylab="b (blue) and c (red)",
col="blue",abline(c (0,0),c (1,1),lty=5,col=320))
由于两个y轴使用不同的比例尺,因此y轴上有两个刻度。我该如何修改我的代码?非常感谢你的帮助!