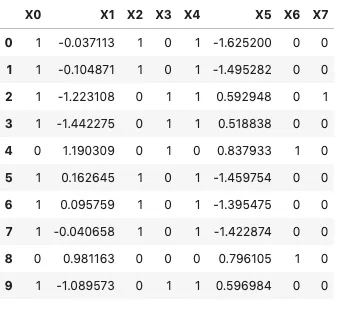
我正在尝试理解如何在数据框的组中识别统计离群值。我需要根据条件对行进行分组,然后将这些组缩减为一行,并在所有缩减行中查找离群值。
df = pd.DataFrame({'X0': {0: 1, 1: 1, 2: 1, 3: 1, 4: 0, 5: 1, 6: 1, 7: 1, 8: 0, 9: 1, 10: 0, 11: 1, 12: 0, 13: 1, 14: 1, 15: 1, 16: 0, 17: 0, 18: 0, 19: 1, 20: 0, 21: 1, 22: 1, 23: 1, 24: 1, 25: 0, 26: 1, 27: 1, 28: 1, 29: 1, 30: 0, 31: 1, 32: 0, 33: 1, 34: 0, 35: 1, 36: 1, 37: 0, 38: 1, 39: 0, 40: 1, 41: 0, 42: 1, 43: 0, 44: 0, 45: 1, 46: 1, 47: 1, 48: 1, 49: 0}, 'X1': {0: -0.037112917323895135, 1: -0.10487134240202785, 2: -1.2231079338781112, 3: -1.4422747724730558, 4: 1.1903093112171788, 5: 0.16264503017608584, 6: 0.09575885513801816, 7: -0.04065753545650327, 8: 0.9811627656097434, 9: -1.0895731715012618, 10: 1.2771663221280398, 11: 0.20642136730493899, 12: 1.4502341066082816, 13: 0.393823431298906, 14: 0.3451716634317143, 15: 0.4709902758164765, 16: 0.9982956103799087, 17: 1.189077916373609, 18: 0.9234439359961105, 19: -1.3255857892440723, 20: 1.2098373846214483, 21: -1.0264301443260604, 22: -1.2752711175444444, 23: -1.1775143284917524, 24: 0.259560479915767, 25: 0.8873566136283076, 26: 0.21516987874467863, 27: -1.1480968752611762, 28: -1.1903434754082, 29: 0.16553499639585526, 30: -0.027563846470247143, 31: 0.19474819789386086, 32: 1.5332001783034717, 33: -1.4746621814990961, 34: 0.9251147862187328, 35: 0.009242841373200278, 36: -1.4155649459675044, 37: 1.1476020465617858, 38: -1.3349528515873126, 39: 1.3090049690691499, 40: -1.0159692538569027, 41: 1.006261902461321, 42: -1.161160155994317, 43: 0.8833114074575376, 44: 1.0811966452823563, 45: -1.368200135415236, 46: -1.556580287072397, 47: -1.2006674694322674, 48: 0.13038922844618558, 49: 0.9941283827531714}, 'X2': {0: 1, 1: 1, 2: 0, 3: 0, 4: 0, 5: 1, 6: 1, 7: 1, 8: 0, 9: 0, 10: 0, 11: 1, 12: 0, 13: 1, 14: 1, 15: 1, 16: 0, 17: 0, 18: 0, 19: 0, 20: 0, 21: 0, 22: 0, 23: 0, 24: 1, 25: 0, 26: 1, 27: 0, 28: 0, 29: 1, 30: 1, 31: 1, 32: 0, 33: 0, 34: 0, 35: 1, 36: 0, 37: 0, 38: 0, 39: 0, 40: 0, 41: 0, 42: 0, 43: 0, 44: 0, 45: 0, 46: 0, 47: 0, 48: 1, 49: 0}, 'X3': {0: 0, 1: 0, 2: 1, 3: 1, 4: 1, 5: 0, 6: 0, 7: 0, 8: 0, 9: 1, 10: 0, 11: 0, 12: 1, 13: 0, 14: 0, 15: 0, 16: 1, 17: 0, 18: 1, 19: 1, 20: 1, 21: 1, 22: 1, 23: 0, 24: 0, 25: 1, 26: 0, 27: 1, 28: 1, 29: 0, 30: 0, 31: 0, 32: 1, 33: 1, 34: 1, 35: 0, 36: 1, 37: 1, 38: 1, 39: 0, 40: 1, 41: 1, 42: 1, 43: 1, 44: 1, 45: 1, 46: 1, 47: 1, 48: 0, 49: 1}, 'X4': {0: 1, 1: 1, 2: 1, 3: 1, 4: 0, 5: 1, 6: 1, 7: 1, 8: 0, 9: 1, 10: 0, 11: 1, 12: 0, 13: 1, 14: 1, 15: 1, 16: 0, 17: 0, 18: 0, 19: 1, 20: 0, 21: 1, 22: 1, 23: 1, 24: 1, 25: 0, 26: 1, 27: 1, 28: 1, 29: 1, 30: 1, 31: 1, 32: 0, 33: 1, 34: 0, 35: 1, 36: 1, 37: 0, 38: 1, 39: 0, 40: 1, 41: 0, 42: 1, 43: 0, 44: 0, 45: 1, 46: 1, 47: 1, 48: 1, 49: 0}, 'X5': {0: -1.6251996907891026, 1: -1.4952824550113089, 2: 0.5929477365851917, 3: 0.5188383985894559, 4: 0.8379329230408614, 5: -1.459754180360659, 6: -1.3954747896019781, 7: -1.4228738797414382, 8: 0.7961049502619677, 9: 0.5969844287269782, 10: 0.6254616540670719, 11: -1.1973174138607352, 12: 0.6743779844553507, 13: -1.3773048616218415, 14: -1.5502881165079259, 15: -1.410649926526345, 16: 0.966418551153225, 17: 0.8413042649713098, 18: 0.5947398261267023, 19: 0.5285211133411081, 20: 0.8154880527487283, 21: 0.685523955516477, 22: 0.7052301139466511, 23: 0.5694387744666269, 24: -1.3660759251156689, 25: 0.7376392137717523, 26: -1.2965881798979835, 27: 0.3247985508699227, 28: 0.8492845744063385, 29: -1.3631982627466268, 30: -1.5593937453283628, 31: -1.5647378670163918, 32: 0.7184017737689418, 33: 0.5401478202493889, 34: 0.8549277265014412, 35: -1.4324174459510242, 36: 0.5699907448414805, 37: 0.5278269967299144, 38: 0.6544095431196703, 39: 0.9956765313323911, 40: 0.49341021793456574, 41: 0.8777030715347666, 42: 0.5628001790223106, 43: 0.6932468790071539, 44: 0.5944907552098264, 45: 0.6628094310909329, 46: 0.660678722318602, 47: 0.68454503898171, 48: -1.5961965190965848, 49: 0.7606527604851616}, 'X6': {0: 0, 1: 0, 2: 0, 3: 0, 4: 1, 5: 0, 6: 0, 7: 0, 8: 1, 9: 0, 10: 1, 11: 0, 12: 1, 13: 0, 14: 0, 15: 0, 16: 1, 17: 1, 18: 1, 19: 0, 20: 1, 21: 0, 22: 0, 23: 0, 24: 0, 25: 1, 26: 0, 27: 0, 28: 0, 29: 0, 30: 0, 31: 0, 32: 1, 33: 0, 34: 1, 35: 0, 36: 0, 37: 1, 38: 0, 39: 1, 40: 0, 41: 1, 42: 0, 43: 1, 44: 1, 45: 0, 46: 0, 47: 0, 48: 0, 49: 1}, 'X7': {0: 0, 1: 0, 2: 1, 3: 0, 4: 0, 5: 0, 6: 0, 7: 0, 8: 0, 9: 0, 10: 0, 11: 0, 12: 0, 13: 0, 14: 0, 15: 0, 16: 0, 17: 0, 18: 0, 19: 0, 20: 0, 21: 1, 22: 0, 23: 1, 24: 0, 25: 0, 26: 0, 27: 0, 28: 1, 29: 0, 30: 0, 31: 0, 32: 0, 33: 1, 34: 0, 35: 0, 36: 1, 37: 0, 38: 1, 39: 0, 40: 1, 41: 0, 42: 0, 43: 0, 44: 0, 45: 1, 46: 0, 47: 1, 48: 0, 49: 0}})
df1 = df[(df['X0'] == 0) & (df['X2'] == 0)]
df2 = df[(df['X0'] == 1) & (df['X3'] == 1)]
df3 = df[(df['X0'] == 1) & (df['X4'] == 1)]
df4 = df[(df['X0'] == 1) & (df['X7'] == 0)]

df5 = df[(df['X2'] == 1) & (df['X6'] == 0)]
df6 = df[(df['X2'] == 1) & (df['X4'] == 1)]
df7 = df[(df['X2'] == 1) & (df['X3'] == 0)]

df8 = df[(df['X3'] == 1) & (df['X7'] == 0)]
df9 = df[(df['X3'] == 1) & (df['X6'] == 1)]

df10 = df[(df['X7'] == 1) & (df['X2'] == 0)]
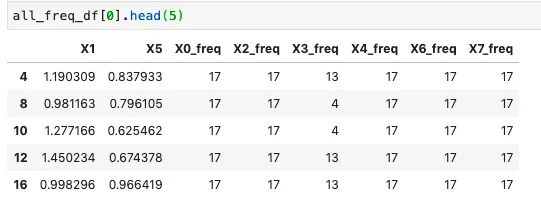
在这一步中,我将每个数据帧缩减为单行。为此,我有几个想法。一个简单的方法是取每个数据帧的平均值,但问题是一些列是分类列,一些是连续列。为了取整个数据帧的平均值,我正在将分类列转换为频率计数列:
cat_columns = ['X0', 'X2', 'X3', 'X4', 'X6', 'X7']
def add_freq(df, column_name):

    for col in cat_columns:
        df[f'{col}_freq'] = df[col].map(df[col].value_counts())
        df = df.drop(col, axis = 1)
    return df


all_groups  = [df1, df2, df3, df4, df5,
              df6, df7, df8, df9, df10]

all_freq_df = [add_freq(group, cat_columns) for group in all_groups]
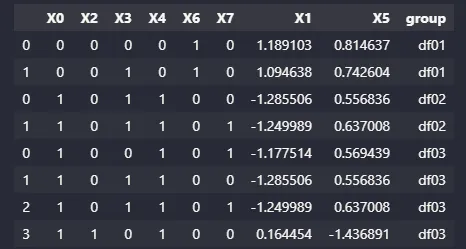
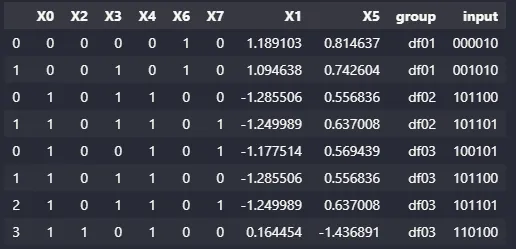
每个数据框组看起来像这样:
all_mean_df = [pd.DataFrame(group.mean()).T for group in all_freq_df]
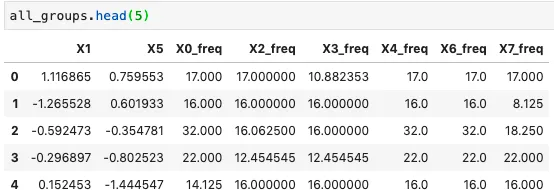
将所有经过缩减的行连接成单个数据框。
all_groups = pd.concat(all_mean_df).reset_index(drop=True)
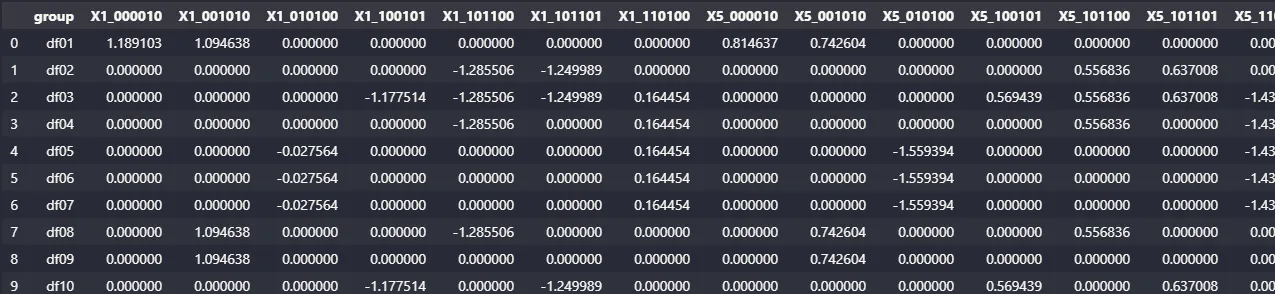
最终的缩减行数据框如下所示,其中每一行代表一个缩减数据框组:
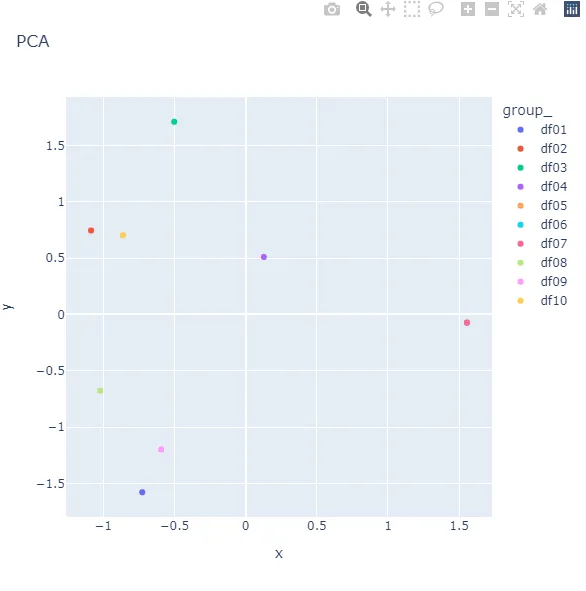
我希望在这个缩小的数据集中找到异常值,我尝试使用zscore来寻找异常值,例如:
from scipy import stats
all_groups[(np.abs(stats.zscore(all_groups)) < 3).all(axis=1)]
但是似乎没有起作用。我觉得一定有一种方法可以在不过于复杂的情况下完成这个任务,但我一直陷入了如何继续的困境。
我该如何将组缩减为单行并找到简化数据集中的异常值?