我有 N 个 subplot,我想让其中除了一个 subplot,其余的 subplot 共享 Y 轴。这是否可能?
2个回答
9
是的,你可以指定哪些子图与哪些轴共享,有sharex和sharey参数可用于add_subplot:
例如:
import numpy as np
import matplotlib.pyplot as plt
x = np.array([1,2,3,4,5])
y1 = np.arange(5)
y2 = y1 * 2
y3 = y1 * 5
fig = plt.figure()
ax1 = fig.add_subplot(131) # independant y axis (for now)
ax1.plot(x, y1)
ax2 = fig.add_subplot(132, sharey=ax1) # share y axis with first plot
ax2.plot(x, y2)
ax3 = fig.add_subplot(133) # independant y axis
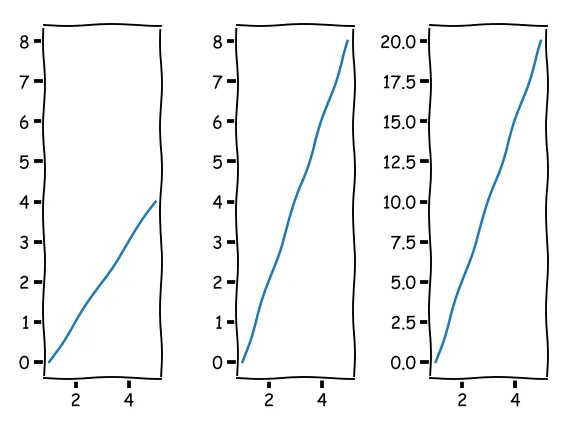
ax3.plot(x, y3)
plt.show()
这将创建一个像这样的图表(第一和第二共用y轴,但第三个不共用):
 您可以在matplotlib示例中找到另一个示例:“共享轴演示”。
- MSeifert
3
如果您正在使用这种格式。
你可以尝试。
每个子图之后。
fig, axs = plt.subplots(4,1,sharex=True,figsize=(8,8))
你可以尝试。
axs[2].sharey(axs[1])

axs[3].sharey(axs[1])
每个子图之后。
- Yeming Chen
网页内容由stack overflow 提供, 点击上面的可以查看英文原文,
原文链接
原文链接
- 相关问题
- 3 Python, Matplotlib自定义坐标轴共享Y轴
- 9 在pyplot中,两个子图共享一个y轴标签
- 5 Matplotlib:如何让一个子图的 x 轴与另一个子图的 y 轴共享?
- 238 在matplotlib中给第二个y轴添加y轴标签
- 3 有没有一种方法可以从matplotlib表面图导出STL文件?
- 72 Matplotlib中如何为部分子图共享坐标轴
- 8 有没有一种方法在matplotlib中获取轴的父画布?
- 14 FacetGrid可视化中如何在行之间共享x轴,在列之间共享y轴?
- 44 如何在matplotlib中在子图之间共享次要y轴
- 16 在matplotlib中,有没有一种方法可以检查当前显示区域的轴中有哪些艺术家?