我正在设置箱线图以在ggplot2的facet_grid中呈现,并且我想增加内部边距。
不幸的是,我无法增加到facet框架的距离。
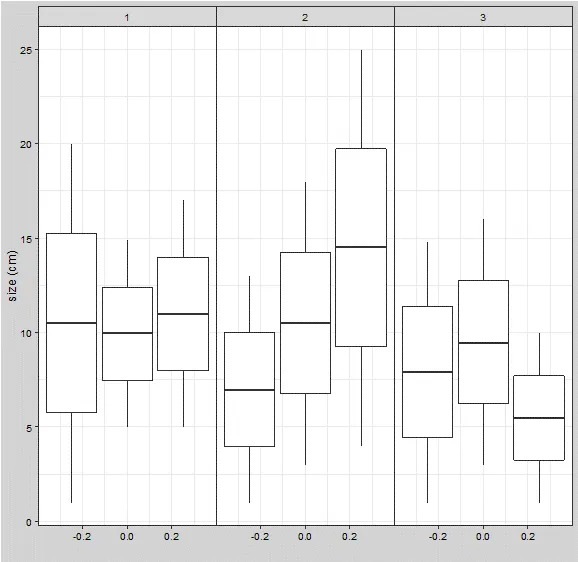
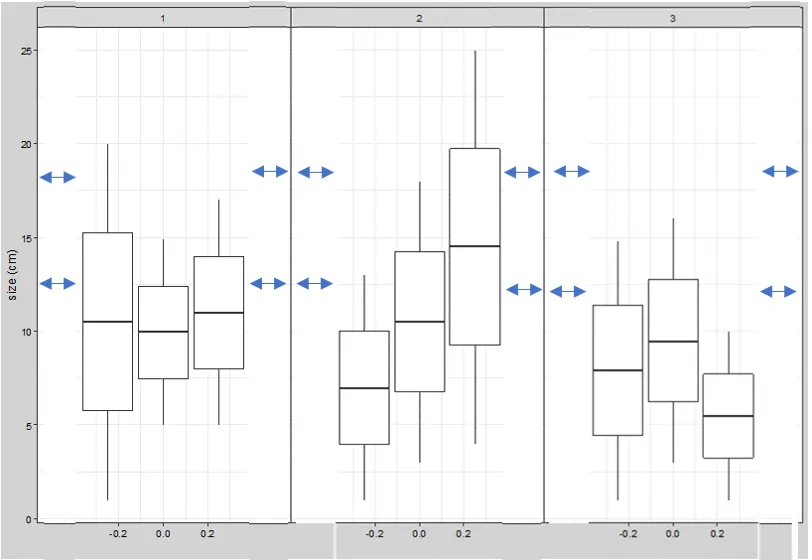
我应该如何增加内部边距(左侧和右侧),如蓝色箭头所示?
require(ggplot2)
dat <- rbind(data.frame(approach=1,product=1,value=seq(1,20,0.5)),
             data.frame(approach=1,product=2,value=seq(5,15,0.3)),
             data.frame(approach=1,product=3,value=seq(5,17,0.2)),
             data.frame(approach=2,product=1,value=seq(1,13,0.3)),
             data.frame(approach=2,product=2,value=seq(3,18,0.5)),
             data.frame(approach=2,product=3,value=seq(4,25,0.7)),
             data.frame(approach=3,product=1,value=seq(1,15,0.6)),
             data.frame(approach=3,product=2,value=seq(3,16,0.5)),
             data.frame(approach=3,product=3,value=seq(1,10,0.1)))

gg1 <- ggplot(dat, aes(group =product, y = value)) +
  geom_boxplot() +
  ylab("size (cm)")+
  theme(panel.spacing = unit(0.1, 'lines')) +
  theme(plot.background = element_rect(fill ="lightgrey" )) +
  scale_fill_grey(start = 0.0, end = 1) +
  theme_bw()+
  xlab("") +
  facet_grid(cols=vars(approach)) +
  theme(axis.text.x = element_text(colour="black")) +
  theme(axis.text.y=element_text(colour="black"))+
  theme(panel.spacing=unit(0,"lines")) +
  guides(fill=guide_legend(title="Products")) +
  theme(plot.background = element_rect(fill ="lightgrey" ))

gg1
此外,对于离散刻度,它会如何工作?
require(ggplot2)
dat <- rbind(data.frame(approach=1,product=1,value=seq(1,20,0.5)),
             data.frame(approach=1,product=2,value=seq(5,15,0.3)),
             data.frame(approach=1,product=3,value=seq(5,17,0.2)),
             data.frame(approach=2,product=1,value=seq(1,13,0.3)),
             data.frame(approach=2,product=2,value=seq(3,18,0.5)),
             data.frame(approach=2,product=3,value=seq(4,25,0.7)),
             data.frame(approach=3,product=1,value=seq(1,15,0.6)),
             data.frame(approach=3,product=2,value=seq(3,16,0.5)),
             data.frame(approach=3,product=3,value=seq(1,10,0.1)))

dat$product<-as.factor(dat$product)

gg1<-ggplot(dat, aes(x =product, y = value)) +
  geom_boxplot() +
  ylab("size (cm)")+
  theme(panel.spacing = unit(0.1, 'lines')) +
  theme(plot.background = element_rect(fill ="lightgrey" )) +
  scale_fill_grey(start = 0.0, end = 1) +
  theme_bw()+ xlab("") +
  facet_grid(cols=vars(approach)) +
  theme(axis.text.x = element_text(colour="black")) +
  theme(axis.text.y=element_text(colour="black"))+
  theme(panel.spacing=unit(0,"lines")) +
  guides(fill=guide_legend(title="Products")) +
  theme(plot.background = element_rect(fill ="lightgrey" ))

gg1
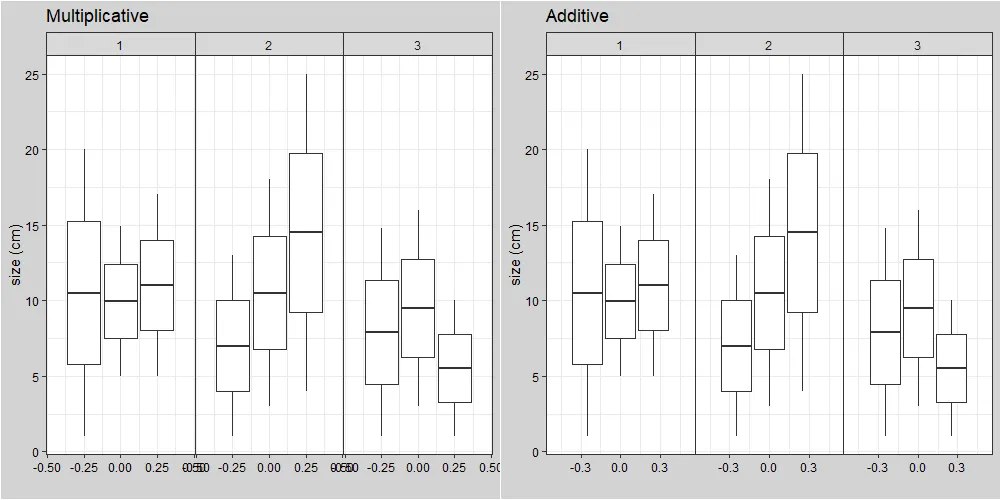
xlim(c(-1,1))。 - J_F