使用gganimate制作动画条形图:在绘图下方标注带有变化文本的框。

3
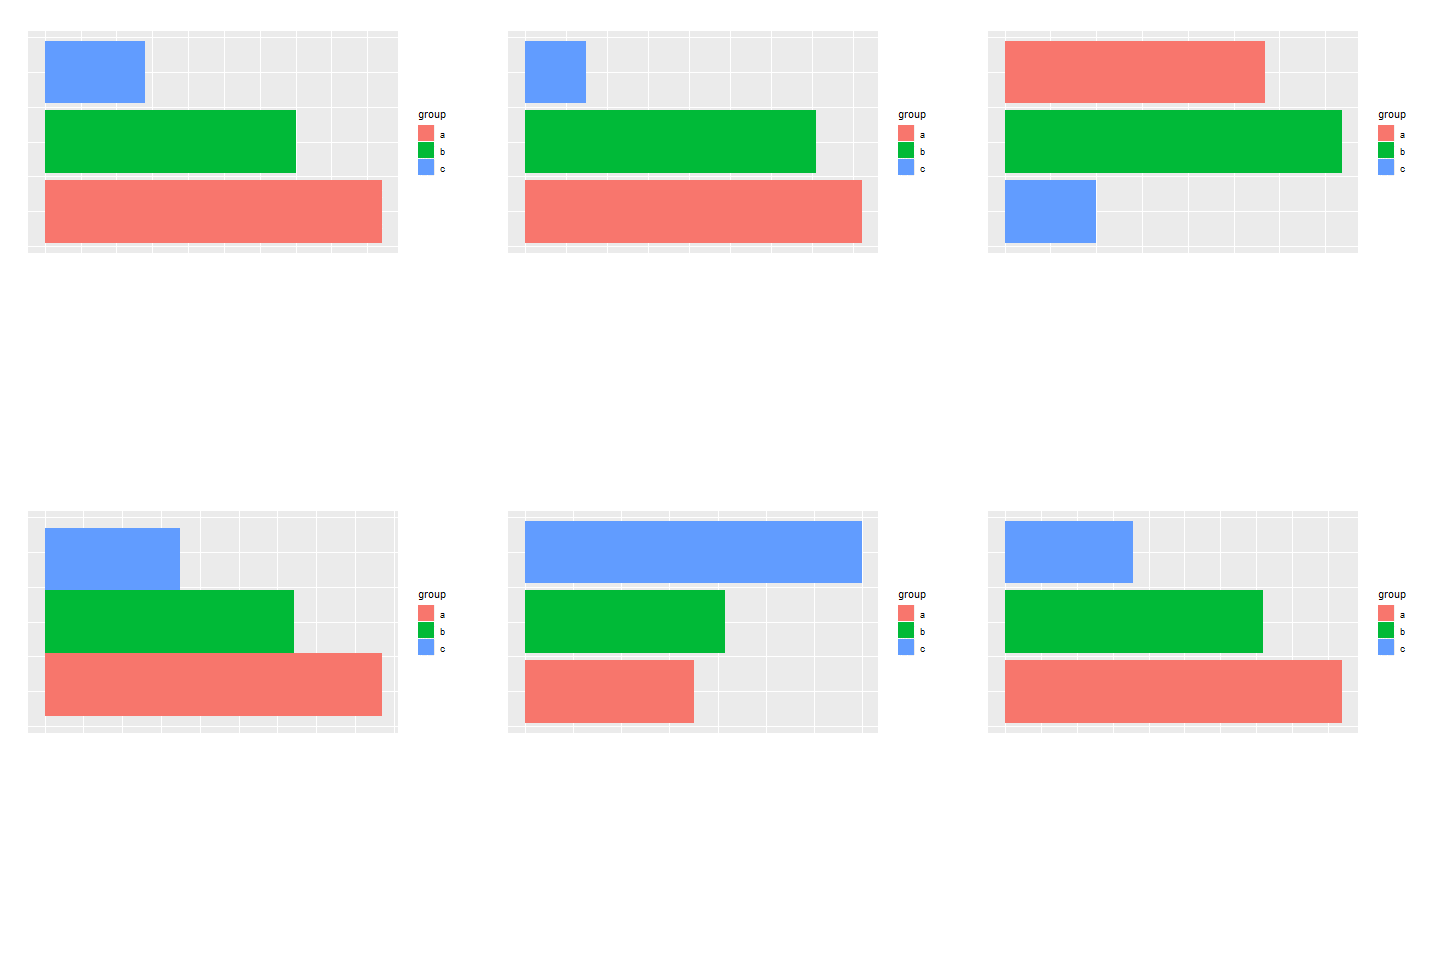
我希望使用gganimate包创建一个动画条形图。在条形图下面,我想要注释一个文本框。盒子内的文本应随时间变化而改变。条形图的x轴应该移动(由view_follow指定)。然而,文本框应在绘图的固定点显示。
考虑以下示例:
# Create example data
df <- data.frame(ordering = c(rep(1:3, 2), 3:1, rep(1:3, 2)),
                 year = factor(sort(rep(2001:2005, 3))),
                 value = round(runif(15, 0, 100)),
                 group = rep(letters[1:3], 5))

library("gganimate")
library("ggplot2")

# Create animated ggplot with coord_flip
ggp <- ggplot(df, aes(x = ordering, y = value)) +
  geom_bar(stat = "identity", aes(fill = group)) +
  transition_states(year, transition_length = 2, state_length = 0) +
  view_follow(fixed_x = TRUE) +
  coord_flip() +
  theme(axis.title.x = element_blank(),
        axis.ticks.x = element_blank(),
        axis.text.x  = element_blank(),
        axis.title.y = element_blank(),
        axis.ticks.y = element_blank(),
        axis.text.y  = element_blank(),
        plot.margin = unit(c(1, 1, 8, 1), "cm"))
enter image description here

问题:如何在此图下方的白色区域中用变化的文本注释文本框?

1
你不能通过annotate传递一个美学元素,因此你需要通过geom_text或者geom_label来实现,或者使用gganimate的标签变量来更新annotate,或者回退到animate并手动完成缓动。不管怎样,保持它在同一位置都会很麻烦,除非你直接使用grid添加它。根据你采取的方法,在白色部分放置它也不容易。 - alistaire
感谢@alistaire的提示。很遗憾听到似乎没有解决方案能够提供所需的输出。 - Joachim Schork
我的意思是,有解决方案;只是它们不是很简单。 - alistaire
@alistaire 感谢您的澄清。不幸的是,我也需要以自动化的方式创建图表,因为我想要创建许多这样的图表。手动解决方案对我来说并不是一个足够的选项。 - Joachim Schork
这不是手动的(没有涉及点击),只是需要更多的代码。预先进行缓动处理,绘制每个图形,添加textGrob,并将所有内容收集到gif中。这完全是可能的 - 甚至可以将其参数化并将其放入函数中,但这并不简单。 - alistaire
@alistaire 好的,再次感谢。我可能会尝试一下,并在找到解决方案时更新这个线程。 - Joachim Schork
2个回答

4
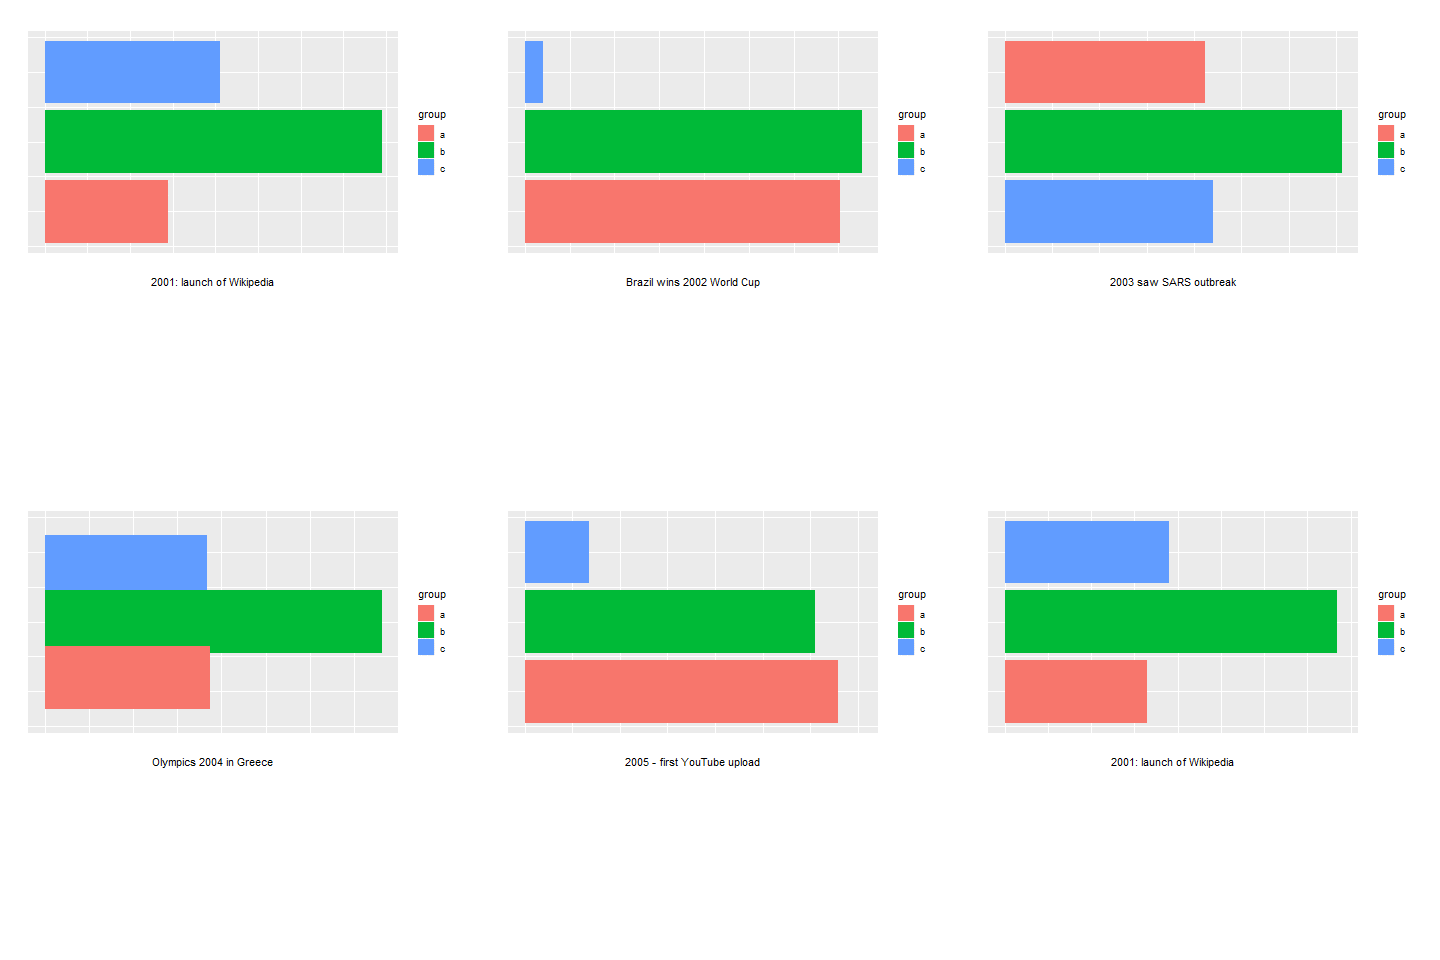
这符合您的需求吗?原始答案翻译成“最初的回答”。
df %>%

  # calculate the value range for each year state
  group_by(year) %>%
  mutate(max.value = max(value)) %>%
  ungroup() %>%

  # add text for each year state (I came up with some random lines for illustration)
  mutate(text = case_when(year == "2001" ~ "2001: launch of Wikipedia",
                          year == "2002" ~ "Brazil wins 2002 World Cup",
                          year == "2003" ~ "2003 saw SARS outbreak",
                          year == "2004" ~ "Olympics 2004 in Greece",
                          TRUE ~ "2005 - first YouTube upload")) %>%

  ggplot(aes(x = ordering, y = value)) +
  geom_col(aes(fill = group)) +

  # add blank layer with maximum value so that the plot's overall range
  # changes smoothly between states
  geom_blank(aes(y = max.value)) +

  # add text layer positioned in the middle, below visible range
  geom_text(aes(y = max.value / 2, label = text),
            x = 0, check_overlap = TRUE) +

  # turn off clipping to show text layer
  coord_flip(clip = "off") +

  theme(axis.title = element_blank(),
        axis.ticks = element_blank(),
        axis.text  = element_blank(),
        plot.margin = unit(c(1, 1, 8, 1), "cm")) +
  # (optional) increase state_length so that the text labels can be viewed longer
  transition_states(year, transition_length = 2, state_length = 2) +
  view_follow(fixed_x = TRUE)

如果文本字符串在每个年份状态下都相同,则生成的geom_text图层在动画期间将保持完全静止。

result

数据:

"Original Answer"翻译成"最初的回答"
set.seed(123)
df <- data.frame(ordering = c(rep(1:3, 2), 3:1, rep(1:3, 2)),
                 year = factor(sort(rep(2001:2005, 3))),
                 value = round(runif(15, 0, 100)),
                 group = rep(letters[1:3], 5))

非常感谢,这正是我所寻找的! - Joachim Schork
@Z.Lin:如果您有时间,能否请您看一下这个问题?https://stackoverflow.com/questions/68564089/r-customizing-animation-text 谢谢! - stats_noob

1

有一种更简单的方法。您可以使用标签注释,只需使用gganimates {glue}类似的注释功能即可。 gganimate不关心您的状态是否为数字。它通过因子水平定义状态顺序。此顺序是可定制的。因此,您可以创建一个自定义因子(!)标签列,并将其用于转换状态,并将其作为“标签”添加到您的绘图中。

library(gganimate)
#> Loading required package: ggplot2

## I am choosing this example in order to show that it does not relate to alphabetical order after custom level definition.
my_labs <- setNames(rev(tail(letters,5)), 2001:2005)
 
## set the level order according to your original states 
df$label <- my_labs[df$year]
df$label <- forcats::fct_inorder(paste(df$label, df$year, sep = ": "))

p <-
  ggplot(df, aes(x = ordering, y = value)) +
  geom_col(aes(fill = group)) +
  coord_flip() +
  theme(
    plot.tag.position = "bottom",
    plot.tag = element_text(hjust = 0)
  ) +
  labs(tag = "{closest_state}")

## obviously, now use the new column as transition state
p + transition_states(label, transition_length = 2, state_length = 0) +
  view_follow(fixed_x = TRUE)

使用reprex v2.0.2于2023年3月7日创建


1
非常感谢提供的替代方案! - Joachim Schork

网页内容由stack overflow 提供, 点击上面的
可以查看英文原文,
原文链接