我有一个问题,需要将图像的直方图拟合到特定范围以获得更好的对比度。首先,我使用的数据从输入图像+直方图到输出图像+直方图再到我想要的输出+直方图:
输入图像: 输入图像的直方图:
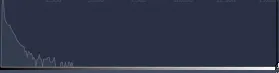 输出图像:
输出图像: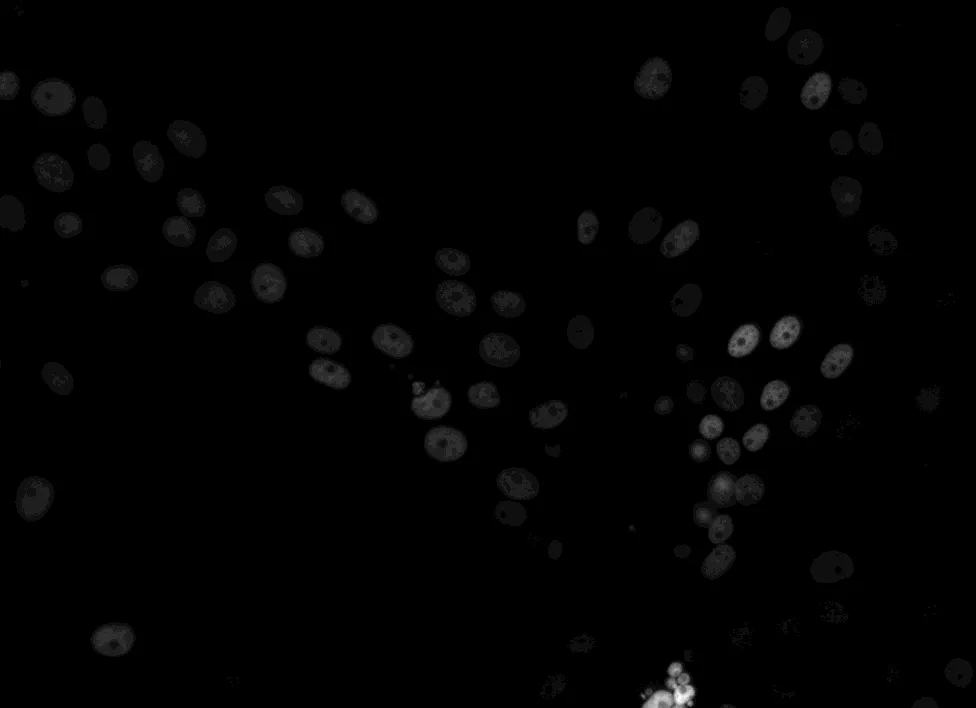 输出图像的直方图:
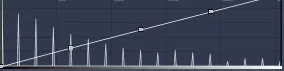 期望的输出(看起来更加平滑):
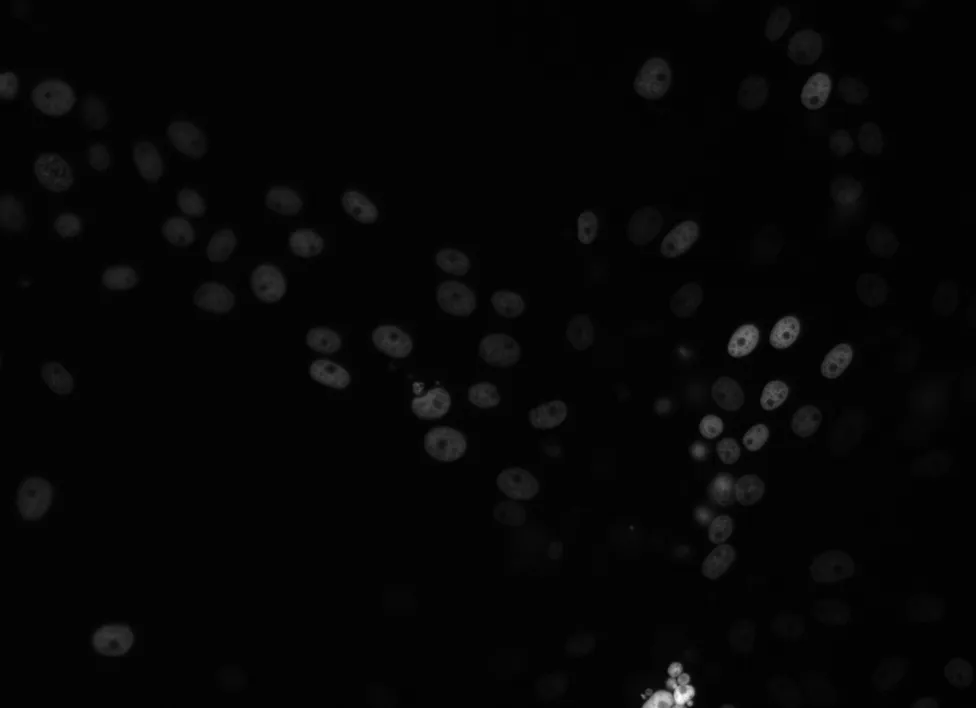 期望输出图像的直方图:
 程序中的方法描述只是说“将黑色映射到最小强度,白色映射到最大强度”。以下是执行映射的代码:
输入图像:
输入图像的直方图:
输出图像:
输出图像的直方图:
期望的输出(看起来更加平滑):
期望输出图像的直方图:
程序中的方法描述只是说“将黑色映射到最小强度,白色映射到最大强度”。以下是执行映射的代码:for y in range(0, h):
for x in range(0, w):
image[y,x] = (((image[y,x] - smallest) / diff) * 65535)
在这段代码中,smallest表示原始图像中最小的强度值,diff表示最大强度和最小强度之间的差异。
为了最终得到更加平滑的直方图,我需要做些什么?
谢谢您的帮助!
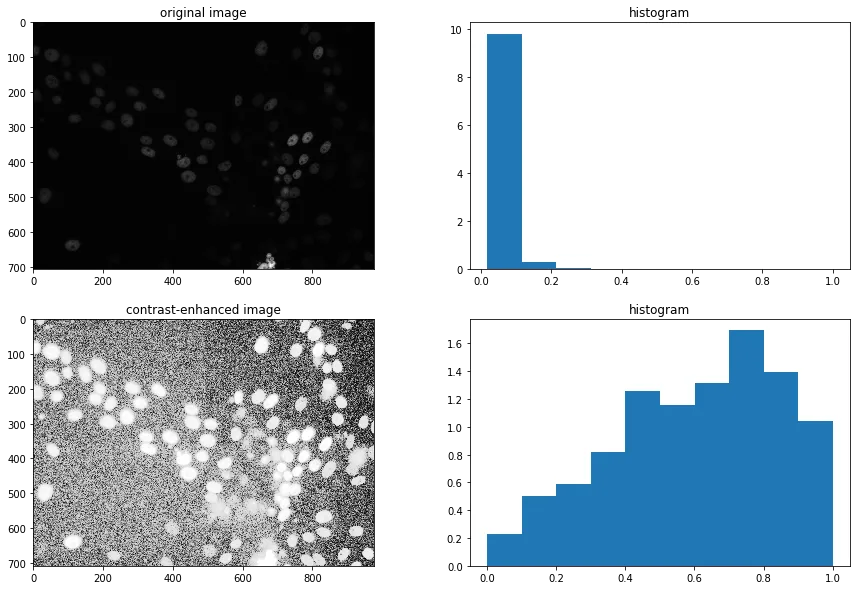
image = cv2.imread(im, 0)读取图像,这将图像转换为8位并进行了一些奇怪的操作。我将其更改为image = cv2.imread(im, -1),现在它可以正常工作了。谢谢! - Philipp Marquardt