我正在尝试在Matlab中实现灰度图像的直方图(我知道有一个自定义函数可以实现),到目前为止,我已经尝试了:
function h = histogram_matlab(imageSource)
openImage = rgb2gray(imread(imageSource));
[rows,cols] =  size(openImage);

histogram_values = [0:255];

for i = 1:rows
  for j = 1:cols
    p = openImage(i,j);
    histogram_values(p) = histogram_values(p) + 1;

  end
end
histogram(histogram_values)
然而当我调用函数时,例如:
histogram_matlab('Harris.png')
我得到了一些类似于:
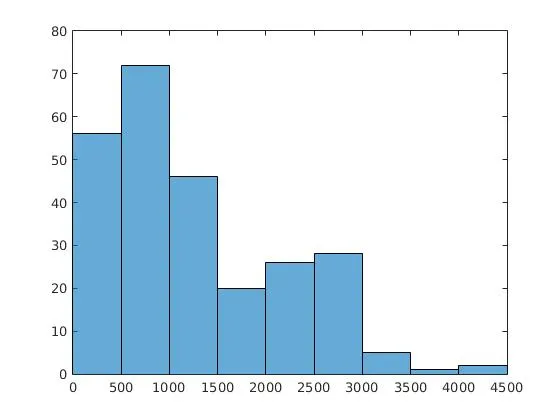 很明显这不是我所期望的结果,x轴应该从0到255,y轴应该从0到存储在
histogram_values中的最大值。我需要获得像
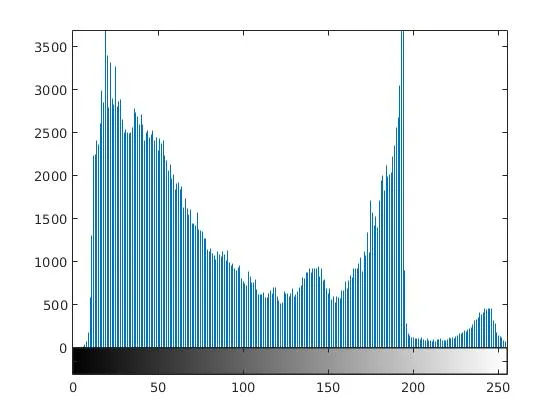
imhist提供的信息:
 我应该如何设置它?我的实现有问题吗?
编辑
我已经按照@rayryeng的建议进行了改进和更正。
function h = histogram_matlab(imageSource)
openImage = rgb2gray(imread(imageSource));
[rows,cols] =  size(openImage);

histogram_values = zeros(256,1)

for i = 1:rows
  for j = 1:cols
    p = double(openImage(i,j)) +1;
    histogram_values(p) = histogram_values(p) + 1;

  end
end
histogram(histogram_values, 0:255)
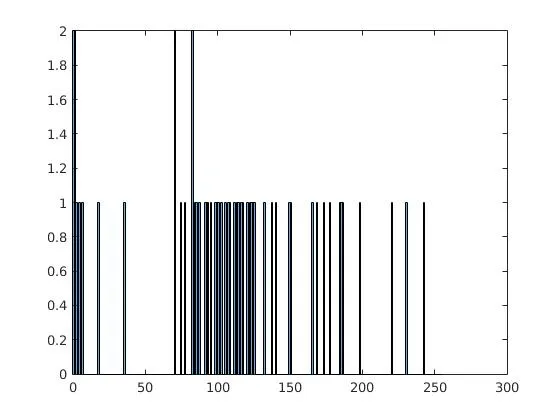
然而,直方图的绘制结果并非如预期那样:
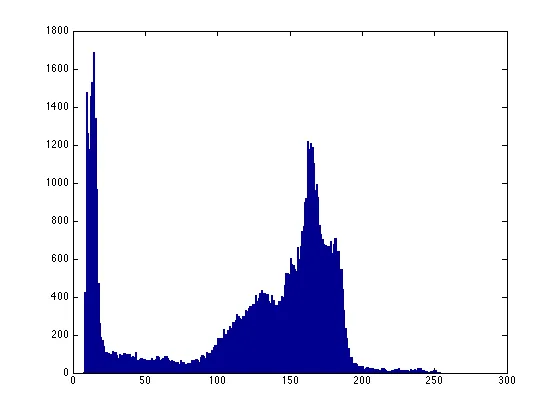
[1 3 2]?为什么不是例如[3 2 1]?由于使用了三个值(即[1 3 2]),您正在创建一个三维矩阵。为什么需要三个维度?im是二维的,为什么不是两个维度? - kkuillaimhist生成的图形完全相同的克隆版本,但它甚至看起来都不像是图像直方图。我该如何改进它呢?此外,很明显它需要在y轴上进行调整。 - diegoaguilarhistogram。我会使用带有histc标志的bar。我会更新我的帖子。 - rayryenga(1,1,:) = 0:255;。 - kkuilla