Python中R table的等效命令

101

我有一个列表

[[12, 6], [12, 0], [0, 6], [12, 0], [12, 0], [6, 0], [12, 6], [0, 6], [12, 0], [0, 6], [0, 6], [12, 0], [0, 6], [6, 0], [6, 0], [12, 0], [6, 0], [12, 0], [12, 0], [0, 6], [0, 6], [12, 6], [6, 0], [6, 0], [12, 6], [12, 0], [12, 0], [0, 6], [6, 0], [12, 6], [12, 6], [12, 6], [12, 0], [12, 0], [12, 0], [12, 0], [12, 6], [12, 0], [12, 0], [12, 6], [0, 6], [0, 6], [6, 0], [12, 6], [12, 6], [12, 6], [12, 6], [12, 6], [12, 0], [0, 6], [6, 0], [12, 0], [0, 6], [12, 6], [12, 6], [0, 6], [12, 0], [6, 0], [6, 0], [12, 6], [12, 0], [0, 6], [12, 0], [12, 0], [12, 0], [6, 0], [12, 6], [12, 6], [12, 6], [12, 6], [0, 6], [12, 0], [12, 6], [0, 6], [0, 6], [12, 0], [0, 6], [12, 6], [6, 0], [12, 6], [12, 6], [12, 0], [12, 0], [12, 6], [0, 6], [6, 0], [12, 0], [6, 0], [12, 0], [12, 0], [12, 6], [12, 0], [6, 0], [12, 6], [6, 0], [12, 0], [6, 0], [12, 0], [6, 0], [6, 0]]

我想要统计这个列表中每个元素出现的频率。

类似这样:

freq[[12,6]] = 40

在R中,可以使用table函数来获得此结果。Python3中有类似的东西吗?

collections.Counter? - jonrsharpe
7个回答

219

Pandas内置了一个名为value_counts()的函数。

例如:如果您的DataFrame具有值为0和1的列,并且您想要计算每个值的总频率,则只需使用此函数:

df.colName.value_counts()

31
这真的应该是最佳答案。 - Max Power
19
value_countspandas.Series类的一种方法,不是pandas.DataFrame。与R中的table函数不同,它仅从列中进行计数,而不是整个数据框。 - Jacquot
谢谢!我忘记往下滚了;我之前已经点赞了这个答案,但是我忘记了! - Corey Levinson
4
使用df.colName.value_counts(dropna=False)可以统计包括缺失值(NaN)在内的值出现的次数。 - vasili111

46

假设您需要将数据转换为pandas DataFrame,这样您就有了

L = [[12, 6], [12, 0], [0, 6], [12, 0], [12, 0], [6, 0], [12, 6], [0, 6], [12, 0], [0, 6], [0, 6], [12, 0], [0, 6], [6, 0], [6, 0], [12, 0], [6, 0], [12, 0], [12, 0], [0, 6], [0, 6], [12, 6], [6, 0], [6, 0], [12, 6], [12, 0], [12, 0], [0, 6], [6, 0], [12, 6], [12, 6], [12, 6], [12, 0], [12, 0], [12, 0], [12, 0], [12, 6], [12, 0], [12, 0], [12, 6], [0, 6], [0, 6], [6, 0], [12, 6], [12, 6], [12, 6], [12, 6], [12, 6], [12, 0], [0, 6], [6, 0], [12, 0], [0, 6], [12, 6], [12, 6], [0, 6], [12, 0], [6, 0], [6, 0], [12, 6], [12, 0], [0, 6], [12, 0], [12, 0], [12, 0], [6, 0], [12, 6], [12, 6], [12, 6], [12, 6], [0, 6], [12, 0], [12, 6], [0, 6], [0, 6], [12, 0], [0, 6], [12, 6], [6, 0], [12, 6], [12, 6], [12, 0], [12, 0], [12, 6], [0, 6], [6, 0], [12, 0], [6, 0], [12, 0], [12, 0], [12, 6], [12, 0], [6, 0], [12, 6], [6, 0], [12, 0], [6, 0], [12, 0], [6, 0], [6, 0]]
df = pd.DataFrame(L, columns=('a', 'b'))

然后您可以按照此答案中建议的方式,使用groupby.size()

tab = df.groupby(['a', 'b']).size()

tab 的外观如下:

In [5]: tab
Out[5]:
a   b
0   6    19
6   0    20
12  0    33
    6    28
dtype: int64

使用unstack()函数,这段内容可以轻松转换成表格形式:

In [6]: tab.unstack()
Out[6]:
b      0     6
a
0    NaN  19.0
6   20.0   NaN
12  33.0  28.0

在您自己的时间里填充 NaN,并转换为int!


15
这与 R 的 table 函数在功能上是等价的。 - Jacquot
1
这正是我正在寻找的。 - Thomas
我尝试在groupby()中使用dropna = False来包含NaN,但它不起作用。还有什么其他方法可以将NaN包含在表格中? - Ankhnesmerira
@Ankhnesmerira,你能提供一个失败的示例吗?在 L 中插入一个 float("nan") 并使用 df.groupby(['a', 'b'], dropna=False).size() 在我的本地机器上运行正常 :-) - thorbjornwolf

45

collections 库中的 Counter 对象将会像这样运行。

from collections import Counter

x = [[12, 6], [12, 0], [0, 6], [12, 0], [12, 0], [6, 0], [12, 6], [0, 6], [12, 0], [0, 6], [0, 6], [12, 0], [0, 6], [6, 0], [6, 0], [12, 0], [6, 0], [12, 0], [12, 0], [0, 6], [0, 6], [12, 6], [6, 0], [6, 0], [12, 6], [12, 0], [12, 0], [0, 6], [6, 0], [12, 6], [12, 6], [12, 6], [12, 0], [12, 0], [12, 0], [12, 0], [12, 6], [12, 0], [12, 0], [12, 6], [0, 6], [0, 6], [6, 0], [12, 6], [12, 6], [12, 6], [12, 6], [12, 6], [12, 0], [0, 6], [6, 0], [12, 0], [0, 6], [12, 6], [12, 6], [0, 6], [12, 0], [6, 0], [6, 0], [12, 6], [12, 0], [0, 6], [12, 0], [12, 0], [12, 0], [6, 0], [12, 6], [12, 6], [12, 6], [12, 6], [0, 6], [12, 0], [12, 6], [0, 6], [0, 6], [12, 0], [0, 6], [12, 6], [6, 0], [12, 6], [12, 6], [12, 0], [12, 0], [12, 6], [0, 6], [6, 0], [12, 0], [6, 0], [12, 0], [12, 0], [12, 6], [12, 0], [6, 0], [12, 6], [6, 0], [12, 0], [6, 0], [12, 0], [6, 0], [6, 0]]

# Since the elements passed to a `Counter` must be hashable, we have to change the lists to tuples.
x = [tuple(element) for element in x]

freq = Counter(x)

print freq[(12,6)]

# Result:  28

31
import pandas
x = [[12, 6], [12, 0], [0, 6], [12, 0], [12, 0], [6, 0], [12, 6], [0, 6], [12, 0], [0, 6], [0, 6], [12, 0], [0, 6], [6, 0], [6, 0], [12, 0], [6, 0], [12, 0], [12, 0], [0, 6], [0, 6], [12, 6], [6, 0], [6, 0], [12, 6], [12, 0], [12, 0], [0, 6], [6, 0], [12, 6], [12, 6], [12, 6], [12, 0], [12, 0], [12, 0], [12, 0], [12, 6], [12, 0], [12, 0], [12, 6], [0, 6], [0, 6], [6, 0], [12, 6], [12, 6], [12, 6], [12, 6], [12, 6], [12, 0], [0, 6], [6, 0], [12, 0], [0, 6], [12, 6], [12, 6], [0, 6], [12, 0], [6, 0], [6, 0], [12, 6], [12, 0], [0, 6], [12, 0], [12, 0], [12, 0], [6, 0], [12, 6], [12, 6], [12, 6], [12, 6], [0, 6], [12, 0], [12, 6], [0, 6], [0, 6], [12, 0], [0, 6], [12, 6], [6, 0], [12, 6], [12, 6], [12, 0], [12, 0], [12, 6], [0, 6], [6, 0], [12, 0], [6, 0], [12, 0], [12, 0], [12, 6], [12, 0], [6, 0], [12, 6], [6, 0], [12, 0], [6, 0], [12, 0], [6, 0], [6, 0]] 
ps = pandas.Series([tuple(i) for i in x])
counts = ps.value_counts()
print counts

你会得到如下结果:

(12, 0)    33
(12, 6)    28
(6, 0)     20
(0, 6)     19

对于[(12,6)],您将获得确切的数字,即28

关于pandas,这是一个强大的Python数据分析工具包,您可以在官方文档中阅读:http://pandas.pydata.org/pandas-docs/stable/

更新:

如果顺序不重要,只需使用sorted:ps = pandas.Series([tuple(sorted(i)) for i in x]),然后结果为:

(0, 6)     39
(0, 12)    33
(6, 12)    28

在Pandas中是否有一种简单的方法来考虑元素相等的排列?[12,0] = [0,12]? - Donbeo
@Donbeo 看更新。排序应该是最简单的方法了;-) - andilabs
如果您可以接受删除重复项,那么使用集合是可以的。只要您不关心[0,1,1]和[0,1]之间的差异,使用集合就可以了。 - andilabs
1
使用 df.colName.value_counts(dropna=False) 来包括 NaN(缺失值计数)。 - vasili111

18

在我看来,pandas为这个“制表”问题提供了更好的解决方案:

一维数组:

my_tab = pd.crosstab(index = df["feature_you_r_interested_in"],
                              columns="count")

比例计数:

my_tab/my_tab.sum()

二维(带总计):

cross = pd.crosstab(index=df["feat1"], 
                             columns=df["feat2"],
                             margins=True)

cross

此外,正如其他同事所提到的那样,pandas的value_counts方法可能是你所需要的全部内容。它非常好用,如果你需要,你甚至可以获得计数的百分比:

df['your feature'].value_counts(normalize=True)

我非常感激这个博客:

http://hamelg.blogspot.com.br/2015/11/python-for-data-analysis-part-19_17.html


链接无法使用。这个可以: http://hamelg.blogspot.com/2015/11/python-for-data-analysis-part-19_17.html - Ivo Fugers
1
谢谢你的第一个解决方案!顺便提一下,你可以在crosstab中使用参数normalize ='columns'来获取比例计数。 - igorkf

10
在Numpy中,我发现最好的方法是使用unique函数,例如:
import numpy as np

# OPs data
arr = np.array([[12, 6], [12, 0], [0, 6], [12, 0], [12, 0], [6, 0], [12, 6], [0, 6], [12, 0], [0, 6], [0, 6], [12, 0], [0, 6], [6, 0], [6, 0], [12, 0], [6, 0], [12, 0], [12, 0], [0, 6], [0, 6], [12, 6], [6, 0], [6, 0], [12, 6], [12, 0], [12, 0], [0, 6], [6, 0], [12, 6], [12, 6], [12, 6], [12, 0], [12, 0], [12, 0], [12, 0], [12, 6], [12, 0], [12, 0], [12, 6], [0, 6], [0, 6], [6, 0], [12, 6], [12, 6], [12, 6], [12, 6], [12, 6], [12, 0], [0, 6], [6, 0], [12, 0], [0, 6], [12, 6], [12, 6], [0, 6], [12, 0], [6, 0], [6, 0], [12, 6], [12, 0], [0, 6], [12, 0], [12, 0], [12, 0], [6, 0], [12, 6], [12, 6], [12, 6], [12, 6], [0, 6], [12, 0], [12, 6], [0, 6], [0, 6], [12, 0], [0, 6], [12, 6], [6, 0], [12, 6], [12, 6], [12, 0], [12, 0], [12, 6], [0, 6], [6, 0], [12, 0], [6, 0], [12, 0], [12, 0], [12, 6], [12, 0], [6, 0], [12, 6], [6, 0], [12, 0], [6, 0], [12, 0], [6, 0], [6, 0]])

values, counts = np.unique(arr, axis=0, return_counts=True)

# into a dict for presentation
{tuple(a):b for a,b in zip(values, counts)}

给我:{(0, 6): 19,(6, 0):20,(12, 0):33,(12, 6):28},这与其他答案相匹配。

这个例子比我通常看到的要复杂一些,因此需要axis=0选项,如果你只想在任何地方获取唯一值,您可以省略它:

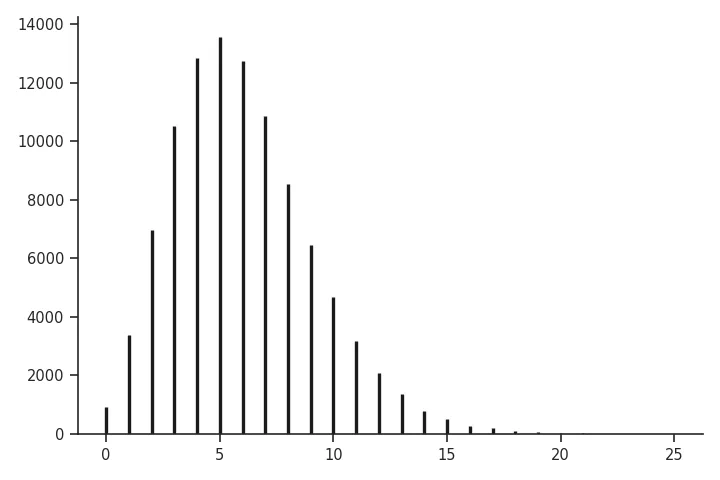
# generate random values
x = np.random.negative_binomial(10, 10/(6+10), 100000)

# get table
values, counts = np.unique(x, return_counts=True)

# plot
import matplotlib.pyplot as plt
plt.vlines(values, 0, counts, lw=2)

Matplotlib输出结果

R似乎使这种事情更加方便!上面的Python代码只是plot(table(rnbinom(100000, 10, mu=6)))


0

你可以使用列表推导式进行一维计数。

L = [[12, 6], [12, 0], [0, 6], [12, 0], [12, 0], [6, 0], [12, 6], [0, 6], [12, 0], [0, 6], [0, 6], [12, 0], [0, 6], [6, 0], [6, 0], [12, 0], [6, 0], [12, 0], [12, 0], [0, 6], [0, 6], [12, 6], [6, 0], [6, 0], [12, 6], [12, 0], [12, 0], [0, 6], [6, 0], [12, 6], [12, 6], [12, 6], [12, 0], [12, 0], [12, 0], [12, 0], [12, 6], [12, 0], [12, 0], [12, 6], [0, 6], [0, 6], [6, 0], [12, 6], [12, 6], [12, 6], [12, 6], [12, 6], [12, 0], [0, 6], [6, 0], [12, 0], [0, 6], [12, 6], [12, 6], [0, 6], [12, 0], [6, 0], [6, 0], [12, 6], [12, 0], [0, 6], [12, 0], [12, 0], [12, 0], [6, 0], [12, 6], [12, 6], [12, 6], [12, 6], [0, 6], [12, 0], [12, 6], [0, 6], [0, 6], [12, 0], [0, 6], [12, 6], [6, 0], [12, 6], [12, 6], [12, 0], [12, 0], [12, 6], [0, 6], [6, 0], [12, 0], [6, 0], [12, 0], [12, 0], [12, 6], [12, 0], [6, 0], [12, 6], [6, 0], [12, 0], [6, 0], [12, 0], [6, 0], [6, 0]]
countey = [tuple(x) for x in L]
freq = {x:countey.count(x) for x in set(countey)}

In [2]: %timeit {x:countey.count(x) for x in set(countey)}
        100000 loops, best of 3: 15.2 µs per loop   

In [4]: print(freq)
Out[4]: {(0, 6): 19, (6, 0): 20, (12, 0): 33, (12, 6): 28}

In [5]: print(freq[(12,6)])
Out[5]: 28

网页内容由stack overflow 提供, 点击上面的
可以查看英文原文,
原文链接