如何在Python中从LAB(l*a*b)颜色空间获取a通道

3

我是opencv的新手,正在尝试将RGB图像转换为LAB颜色空间。我使用以下代码进行操作:

data_path = 'D:/Images/'
image_name= '1.png'
img = cv2.imread(os.path.join(data_path, image_name),cv2.IMREAD_COLOR) # Reads image from disk 
img = cv2.cvtColor(img, cv2.COLOR_BGR2LAB) # changes RGB to LAB color space

img = img [127.5, 1, 127.5]  # This i was trying to get a-channel only but gives error

现在我只想使用LAB图像的a通道作为我的程序的一个通道输入。如何仅使用LAB颜色空间图像的a通道?


你的意思是要将L通道导入到一个单独的程序中,可能是用不同的编程语言实现的吗? - Mark Setchell
@ Mark Setchell 我想要分离每个通道,并且只使用 a 通道输出。我已经使用 split 函数完成了这个操作。谢谢。 l_channel, a_channel, b_channel = cv2.split(img) - Kanvas
为什么人们想要对所有东西进行负面评价?这是一个真诚的问题。 - Kanvas
我也不太清楚。除非答案明显错误且可能导致伤害或危险,否则我几乎从不点踩。好的答案自然会通过点赞浮现到最上面,而没有恶毒和报复性的点踩。但是,这个世界需要各种各样的人... - Mark Setchell
3个回答

6

我正在使用opencv2和python来解决这个问题

    import cv2
    input = cv2.imread('path_to_image.png')
    cv2.imshow('Hello World', input)
    cv2.waitKey(0)
    cv2.destroyAllWindows()

    lab = cv2.cvtColor(input,cv2.COLOR_BGR2LAB)
    cv2.imshow("l*a*b",lab)

    L,A,B=cv2.split(lab)
    cv2.imshow("L_Channel",L) # For L Channel
    cv2.imshow("A_Channel",A) # For A Channel (Here's what You need)
    cv2.imshow("B_Channel",B) # For B Channel

    cv2.waitKey(0)
    cv2.destroyAllWindows()

希望这可以帮助你解决问题。

1
我已经通过以下代码解决了我的问题。
l_channel, a_channel, b_channel = cv2.split(img) #splits the image into 3 channles l, a and b

它将图像分成了我想要的l、a和b通道。这很容易,但由于我是opencv新手,所以不知道这一点。

0

这里是在Python中绘制Lab通道的方法。您可以在本文中找到更多详细信息,我已将其用作参考。

    from keras.preprocessing.image import  img_to_array, load_img
    from skimage.color import rgb2lab, lab2rgb
    import matplotlib.pyplot as plt
    import numpy as np
    
    def extract_single_dim_from_LAB_convert_to_RGB(image,idim):
        '''
        image is a single lab image of shape (None,None,3)
        '''
        z = np.zeros(image.shape)
        if idim != 0 :
            z[:,:,0]=80 ## I need brightness to plot the image along 1st or 2nd axis
        z[:,:,idim] = image[:,:,idim]
        z = lab2rgb(z)
        return(z)
    
    def plot_lab_spectrums():
        # Get image
        img = img_to_array(load_img("<image_path>",target_size=(400,400)))
        lab = rgb2lab(img/255.0)
        lab_l = extract_single_dim_from_LAB_convert_to_RGB(lab,0)
        lab_a = extract_single_dim_from_LAB_convert_to_RGB(lab,1)
        lab_db = extract_single_dim_from_LAB_convert_to_RGB(lab,2)
    
        # Plot the results
        fig, axes = plt.subplots(ncols=3, figsize=(12, 4))
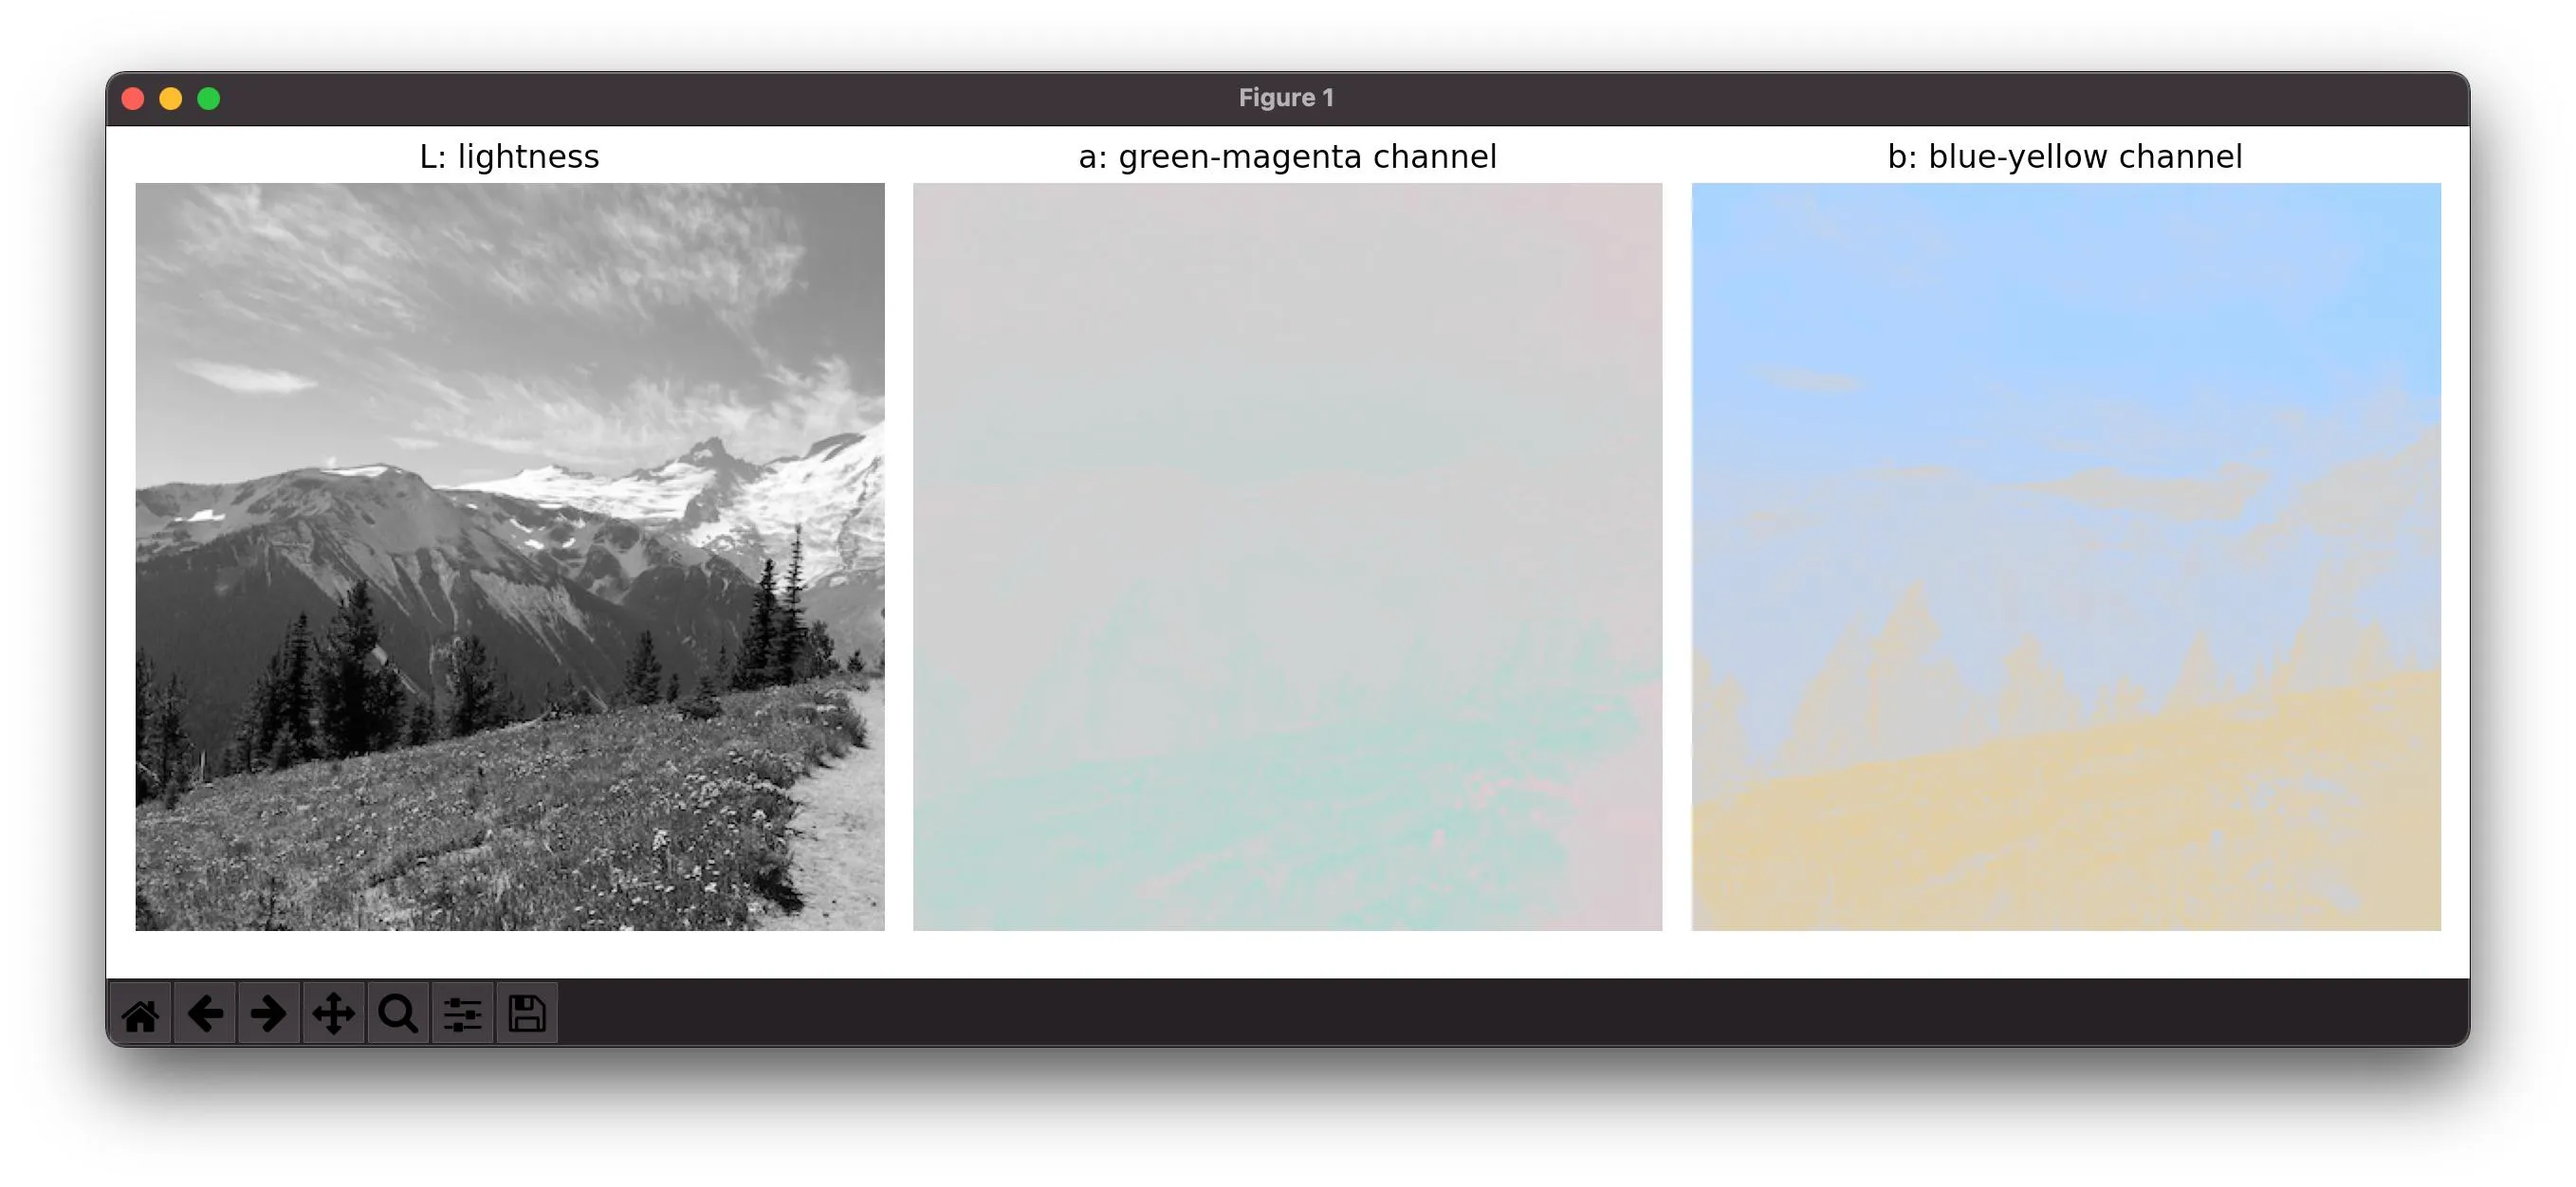
        data = [('L: lightness', lab_l), ('a: green-magenta channel', lab_a), ('b: blue-yellow channel', lab_db)]
    
        for ax, (title, img) in zip(axes, data):
            ax.set_title(title)
            ax.imshow(img)
            ax.axis('off')
    
        fig.tight_layout()
        plt.show()
    
    plot_lab_spectrums()

enter image description here


网页内容由stack overflow 提供, 点击上面的
可以查看英文原文,
原文链接