这个有点棘手,我来解释一下。基本上,我想制作一个嵌入式图表,然后利用mpl_toolkits.axes_grid1.inset_locator.mark_inset的便利性,但是我希望嵌入式图表中的数据完全独立于父轴中的数据。
以下是使用我想要的函数的示例代码:
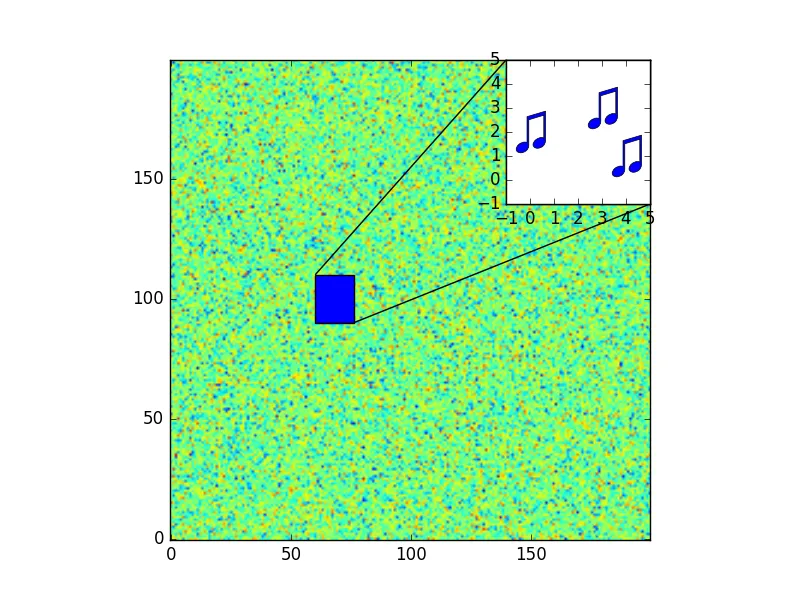
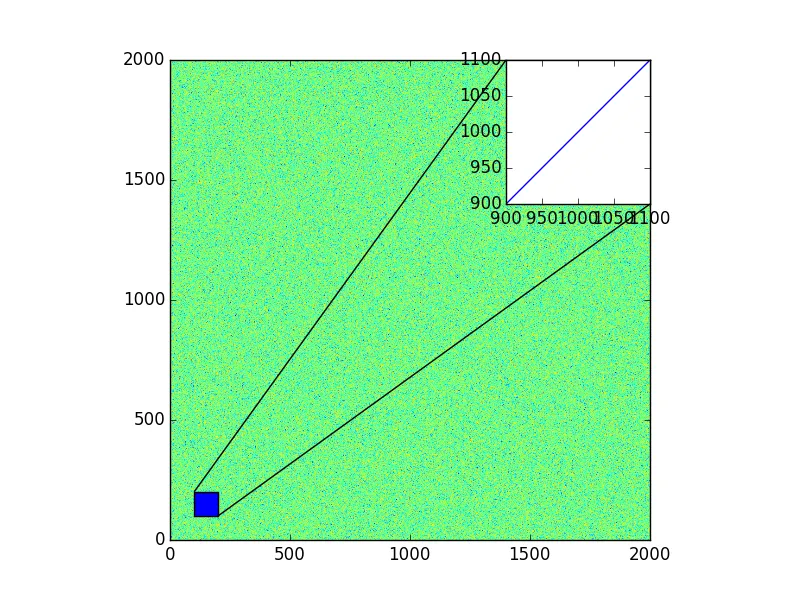
示例代码生成以下图像: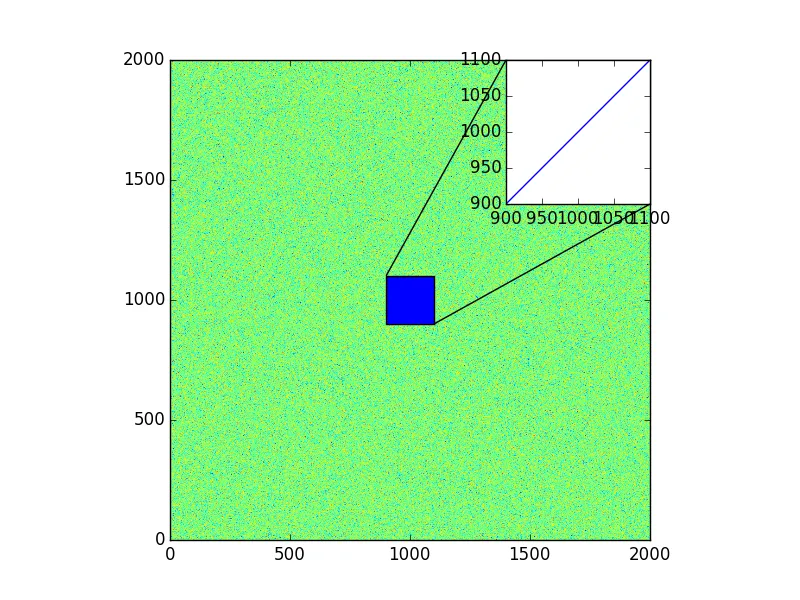 简而言之,蓝色框的位置完全由输入ax2.plot()的数据控制。我想手动放置蓝色框并在ax2中输入任何我想要的内容。这可行吗?
快速编辑:为清楚起见,我理解插入图表为什么会有数据链接,因为这是最常见的用法。因此,如果在matplotlib中有完全不同的方法可以实现此目的,请随时回复。但是,我正在尝试避免手动放置框和线到我将放置的所有轴上,因为我需要将很多插图插入到大图像中。
以下是使用我想要的函数的示例代码:
import numpy as np

import matplotlib.pyplot as plt
from mpl_toolkits.axes_grid1.inset_locator import inset_axes
from mpl_toolkits.axes_grid1.inset_locator import mark_inset
from mpl_toolkits.axes_grid1.inset_locator import InsetPosition

data = np.random.normal(size=(2000,2000))
plt.imshow(data, origin='lower')
parent_axes = plt.gca()

ax2 = inset_axes(parent_axes, 1, 1)
ax2.plot([900,1100],[900,1100])

# I need more control over the position of the inset axes than is given by the inset_axes function
ip = InsetPosition(parent_axes,[0.7,0.7,0.3,0.3])
ax2.set_axes_locator(ip)

# I want to be able to control where the mark is connected to, independently of the data in the ax2.plot call
mark_inset(parent_axes, ax2, 2,4)

# plt.savefig('./inset_example.png')
plt.show()
示例代码生成以下图像:
简而言之,蓝色框的位置完全由输入ax2.plot()的数据控制。我想手动放置蓝色框并在ax2中输入任何我想要的内容。这可行吗?快速编辑:为清楚起见,我理解插入图表为什么会有数据链接,因为这是最常见的用法。因此,如果在matplotlib中有完全不同的方法可以实现此目的,请随时回复。但是,我正在尝试避免手动放置框和线到我将放置的所有轴上,因为我需要将很多插图插入到大图像中。