我的目标是用Python创建一个加拿大的分级统计地图。假设我有一个包含每个加拿大省/地区值的字典:
myvalues={'Alberta': 1.0,
 'British Columbia': 2.0,
 'Manitoba': 3.0,
 'New Brunswick': 4.0,
 'Newfoundland and Labrador': 5.0,
 'Northwest Territories': 6.0,
 'Nova Scotia': 7.0,
 'Nunavut': 8.0,
 'Ontario': 9.0,
 'Prince Edward Island': 10.0,
 'Quebec': 11.0,
 'Saskatchewan': 12.0,
 'Yukon': 13.0}
现在我想根据myvalues中相应的值,使用连续的彩图(例如红色阴影)对每个省份进行着色。 该怎么做?
到目前为止,我只能够在matplotlib中绘制加拿大省/地区,但它们的形状以唯一的颜色出现,我不知道如何根据myvalues中的数字更改它们的颜色(也许我需要玩弄patches,但我不知道如何)。
这是您可以找到shapefile的位置:http://www.filedropper.com/canadm1_1
这是我的迄今为止的代码:
import shapefile
import matplotlib.pyplot as plt
import matplotlib.patches as patches
from matplotlib.patches import Polygon
from matplotlib.collections import PatchCollection
# -- input --
sf = shapefile.Reader("myfolder\CAN_adm1.shp")
recs = sf.records()
shapes = sf.shapes()
Nshp = len(shapes)
cns = []
for nshp in xrange(Nshp):
cns.append(recs[nshp][1])
cns = array(cns)
cm = get_cmap('Dark2')
cccol = cm(1.*arange(Nshp)/Nshp)
# -- plot --
fig = plt.figure()
ax = fig.add_subplot(111)
for nshp in xrange(Nshp):
ptchs = []
pts = array(shapes[nshp].points)
prt = shapes[nshp].parts
par = list(prt) + [pts.shape[0]]
for pij in xrange(len(prt)):
ptchs.append(Polygon(pts[par[pij]:par[pij+1]]))
ax.add_collection(PatchCollection(ptchs,facecolor=None,edgecolor='k', linewidths=.5))
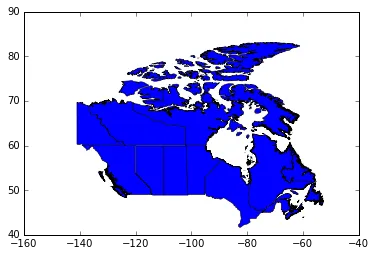
ax.set_xlim(-160,-40)
ax.set_ylim(40,90)
目前我得到的图片是:
编辑
我认为解决方案必须在以下行中:
cm    = get_cmap('OrRd')
cccol = cm(1.*arange(Nshp)/Nshp)
上述脚本创建了一个cccol数组,实际上它的形状如下:
array([[ 1.        ,  0.96862745,  0.9254902 ,  1.        ],
       [ 0.99766244,  0.93356402,  0.84133796,  1.        ],
       [ 0.99520185,  0.89227221,  0.74749713,  1.        ],
       [ 0.99274125,  0.84306037,  0.64415227,  1.        ],
       [ 0.99215686,  0.78754327,  0.5740254 ,  1.        ],
       [ 0.99186467,  0.71989237,  0.50508269,  1.        ],
       [ 0.98940408,  0.60670514,  0.39927722,  1.        ],
       [ 0.97304114,  0.50618995,  0.32915034,  1.        ],
       [ 0.94105344,  0.40776625,  0.28732027,  1.        ],
       [ 0.88521339,  0.28115341,  0.19344868,  1.        ],
       [ 0.8220992 ,  0.16018455,  0.10345252,  1.        ],
       [ 0.73351789,  0.04207613,  0.02717416,  1.        ],
       [ 0.61959248,  0.        ,  0.        ,  1.        ]])
我不知道为什么它有4列,但我想如果我能将此数组的值与values字典中指定的那些值链接起来,我就可以解决这个问题。 有什么想法吗?
编辑2
我已经找到了“诀窍”的方法,就在cccol = cm()中。 为了将其与省份相关联,我尝试分配 cccol = cm(myvalues.values(i) for i in myvalues.keys())
这样(至少在我的脑海中)每个颜色都是基于相关键分配的,没有任何错位。 问题是我遇到了错误:
TypeError:Cannot cast array data from dtype('O') to dtype('int32') according to the rule 'safe'。
如何解决这个问题?
*.shp文件,而没有附带的文件(例如CAN_adm1.shx、CAN_adm1.dbf等)。您能否提供一个包含所有文件的ZIP文件链接? - Jeff G