我可以在ggplot的柱状图/条形图上方添加分组线标签吗?

3

我希望在我的ggplot条形图上方添加分组标签。这样的功能在数据可视化中已经存在,比如在ggtree中的系统发生树中,但我还没有找到一种在ggplot中实现它的方法。

我尝试使用geom_text和geom_label,但是还没有成功。也许有其他包可以实现这个功能?我附上了一些示例代码,完全可以复现。我想要评级变量横跨多个列出的大陆的条形图。

非常感谢任何帮助!谢谢!

P.S. 不好意思有那么多注释 - 我正在写一个教程。

#load necessary packages
library(tidyverse)
library(stringr)
library(hrbrthemes)
library(scales)

#load data
covid<- read_csv("https://raw.githubusercontent.com/owid/covid-19-data/master/public/data/owid-covid-data.csv", na = ".")  

#this makes a new dataframe (total_cases) that only has the latest COVID cases count and location data
total_cases <- covid %>% filter(date == "2021-05-23") %>% 
  group_by(location, total_cases) %>% 
  summarize()

#get number for world total cases. 
world <- total_cases %>%
  filter(location == "World") %>%
  select(total_cases)

#make new column that has the proportion of total world cases (number was total on that day)
total_cases$prop_total <- total_cases$total_cases/world$total_cases

#this specifies what the continents are so we can filter them out with dplyr
continents <- c("North America", "South America", "Antarctica", "Asia", "Europe", "Africa", "Australia")

#Using dyplr, we're choosing total_cases pnly for the continents
contin_cases <- total_cases %>%
  filter(location %in% continents)

#Loading a colorblind accessible palette
cbbPalette <- c("#000000", "#E69F00", "#56B4E9", "#009E73", "#F0E442", "#0072B2", "#D55E00", "#CC79A7")

#Add a column that rates proportion of cases categorically.   
contin_cases <- contin_cases %>% 
  mutate(rating = case_when(prop_total <= 0.1 ~ 'low',
                            prop_total <= 0.2 ~ 'medium',
                            prop_total <= 1 ~ 'high'))

#Ploting it on a bar chart. 
plot1 <- ggplot(contin_cases, 
           aes(x = reorder(location, prop_total),
               y = prop_total,
               fill = location)) +
  geom_bar(stat="identity", color="white") +
  ylim(0, 1) +
  geom_text(aes(y = prop_total,
                label = round(prop_total, 4)),
            vjust = -1.5) +
  scale_fill_manual(name = "Continent", 
                    values = cbbPalette) +
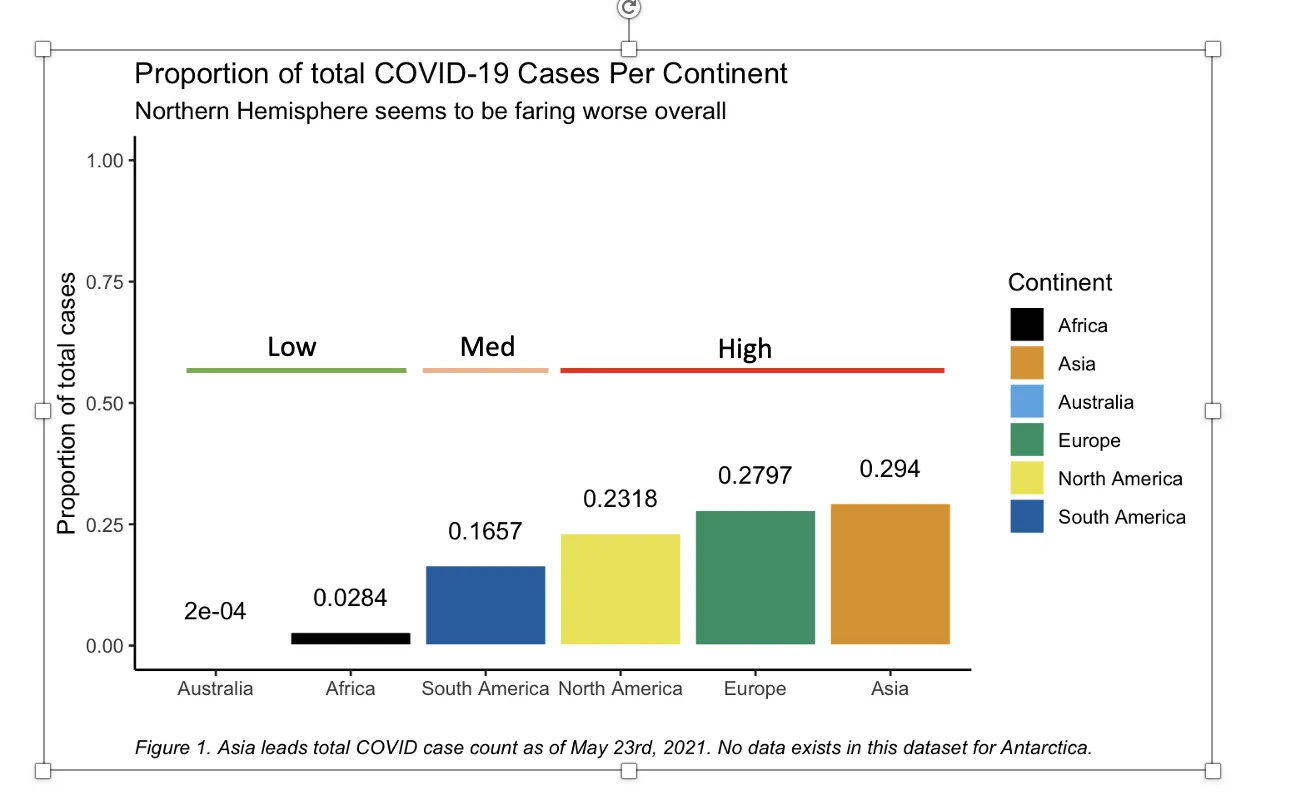
  labs(title = "Proportion of total COVID-19 Cases Per Continent", 
       caption ="Figure 1. Asia leads total COVID case count as of May 23rd, 2021. No data exists in this dataset for Antarctica.") +
  ylab("Proportion of total cases") +
  xlab("") + #this makes x-axis blank
  theme_classic()+
    theme(
    plot.caption = element_text(hjust = 0, face = "italic"))

plot1

这是类似于我要实现的内容:

柱状图显示2021年5月各大洲的COVID总病例数

1个回答

2

实现您所需结果的一种方法是通过geom_segment。为此,我首先准备了一个数据集,其中包含按评级组放置在条形图顶部的段的起始和结束位置。基本上,这涉及将离散位置转换为数字。

之后,添加线段和标签就相当简单了。

library(tidyverse)
library(hrbrthemes)
library(scales)

# Loading a colorblind accessible palette
cbbPalette <- c("#000000", "#E69F00", "#56B4E9", "#009E73", "#F0E442", "#0072B2", "#D55E00", "#CC79A7")

width <- .45 # Half of default width of bars
df_segment <- contin_cases %>% 
  ungroup() %>% 
  # Convert location to numerics
  mutate(loc_num = as.numeric(fct_reorder(location, prop_total))) %>%
  group_by(rating) %>% 
  summarise(x = min(loc_num) - width, xend = max(loc_num) + width,
            y = max(prop_total) * 1.5, yend = max(prop_total) * 1.5)

ggplot(
  contin_cases,
  aes(
    x = reorder(location, prop_total),
    y = prop_total,
    fill = location
  )
) +
  geom_bar(stat = "identity", color = "white") +
  ylim(0, 1) +
  geom_segment(data = df_segment, aes(x = x, xend = xend, y = max(y), yend = max(yend), 
                                      color = rating, group = rating), 
               inherit.aes = FALSE, show.legend = FALSE) +
  geom_text(data = df_segment, aes(x = .5 * (x + xend), y = max(y), label = str_to_title(rating), color = rating), 
            vjust = -.5, inherit.aes = FALSE, show.legend = FALSE) +
  geom_text(aes(
    y = prop_total,
    label = round(prop_total, 4)
  ),
  vjust = -1.5
  ) +
  scale_fill_manual(
    name = "Continent",
    values = cbbPalette
  ) +
  labs(
    title = "Proportion of total COVID-19 Cases Per Continent",
    caption = "Figure 1. Asia leads total COVID case count as of May 23rd, 2021. No data exists in this dataset for Antarctica."
  ) +
  ylab("Proportion of total cases") +
  xlab("") + # this makes x-axis blank
  theme_classic() +
  theme(
    plot.caption = element_text(hjust = 0, face = "italic")
  )

数据

contin_cases <- structure(list(location = c(
  "Africa", "Asia", "Australia", "Europe",
  "North America", "South America"
), total_cases = c(
  4756650, 49204489,
  30019, 46811325, 38790782, 27740153
), prop_total = c(
  0.0284197291646085,
  0.293983843894959, 0.000179355607369132, 0.2796853202015, 0.231764691226676,
  0.165740097599109
), rating = c(
  "low", "high", "low", "high",
  "high", "medium"
)), class = c(
  "grouped_df", "tbl_df", "tbl",
  "data.frame"
), row.names = c(NA, -6L), groups = structure(list(
  location = c(
    "Africa", "Asia", "Australia", "Europe", "North America",
    "South America"
  ), .rows = structure(list(
    1L, 2L, 3L, 4L,
    5L, 6L
  ), ptype = integer(0), class = c(
    "vctrs_list_of",
    "vctrs_vctr", "list"
  ))
), row.names = c(NA, -6L), class = c(
  "tbl_df",
  "tbl", "data.frame"
), .drop = TRUE))

网页内容由stack overflow 提供, 点击上面的
可以查看英文原文,
原文链接