我正在尝试在Python中应用PCA进行多元分析,并绘制前两个成分的得分图,配合Hotelling T2置信度椭圆。我已经成功绘制了散点图,现在想要在散点图上添加95%置信度椭圆。如果有人知道如何在Python中实现这一点,那将非常棒。
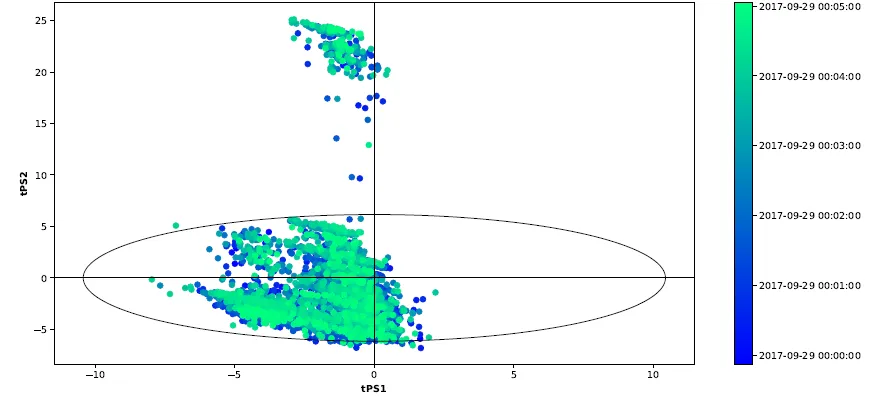
期望输出的示例图片:
期望输出的示例图片:
这让我很困扰,所以我采用了PCA 和 Hotelling's T^2 for confidence intervall in R的答案,并在Python中使用了一些ggbiplot R包的源代码。
from sklearn import decomposition
from sklearn.preprocessing import StandardScaler
import numpy as np
import matplotlib.pyplot as plt
import scipy, random
#Generate data and fit PCA
random.seed(1)
data = np.array(np.random.normal(0, 1, 500)).reshape(100, 5)
outliers = np.array(np.random.uniform(5, 10, 25)).reshape(5, 5)
data = np.vstack((data, outliers))
pca = decomposition.PCA(n_components = 2)
scaler = StandardScaler()
scaler.fit(data)
data = scaler.transform(data)
pcaFit = pca.fit(data)
dataProject = pcaFit.transform(data)
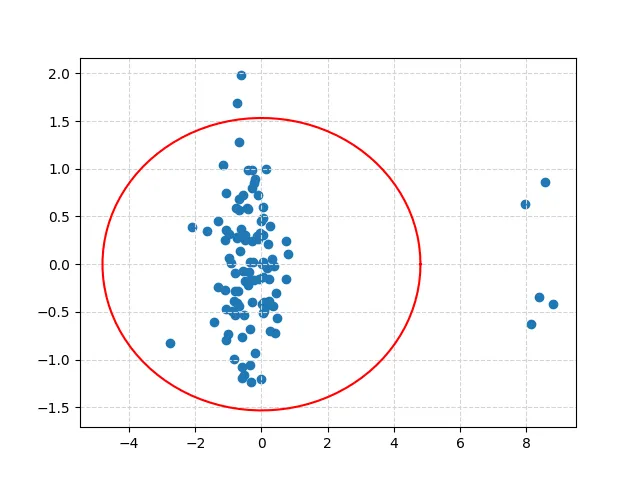
#Calculate ellipse bounds and plot with scores
theta = np.concatenate((np.linspace(-np.pi, np.pi, 50), np.linspace(np.pi, -np.pi, 50)))
circle = np.array((np.cos(theta), np.sin(theta)))
sigma = np.cov(np.array((dataProject[:, 0], dataProject[:, 1])))
ed = np.sqrt(scipy.stats.chi2.ppf(0.95, 2))
ell = np.transpose(circle).dot(np.linalg.cholesky(sigma) * ed)
a, b = np.max(ell[: ,0]), np.max(ell[: ,1]) #95% ellipse bounds
t = np.linspace(0, 2 * np.pi, 100)
plt.scatter(dataProject[:, 0], dataProject[:, 1])
plt.plot(a * np.cos(t), b * np.sin(t), color = 'red')
plt.grid(color = 'lightgray', linestyle = '--')
plt.show()
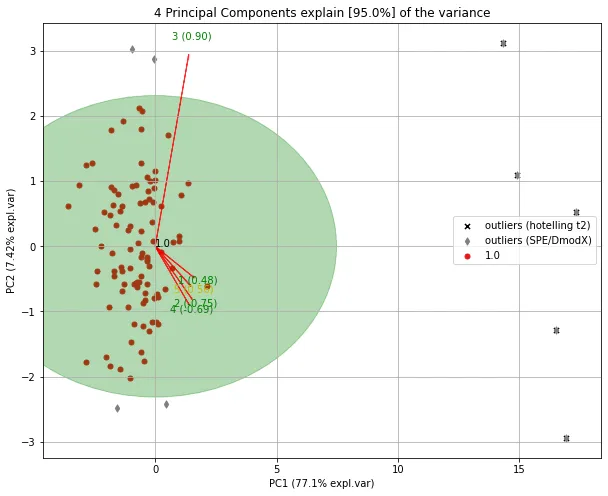
pca库提供Hotelling T2和SPE/DmodX异常点检测功能。
pip install pca

from pca import pca
import pandas as pd
import numpy as np

# Create dataset with 100 samples
X = np.array(np.random.normal(0, 1, 500)).reshape(100, 5)
# Create 5 outliers
outliers = np.array(np.random.uniform(5, 10, 25)).reshape(5, 5)
# Combine data
X = np.vstack((X, outliers))

# Initialize model. Alpha is the threshold for the hotellings T2 test to determine outliers in the data.
model = pca(alpha=0.05)

# Fit transform
out = model.fit_transform(X)
使用以下代码打印异常值
print(out['outliers'])

#            y_proba      y_score  y_bool  y_bool_spe  y_score_spe
# 1.0   9.799576e-01     3.060765   False       False     0.993407
# 1.0   8.198524e-01     5.945125   False       False     2.331705
# 1.0   9.793117e-01     3.086609   False       False     0.128518
# 1.0   9.743937e-01     3.268052   False       False     0.794845
# 1.0   8.333778e-01     5.780220   False       False     1.523642
# ..             ...          ...     ...         ...          ...
# 1.0   6.793085e-11    69.039523    True        True    14.672828
# 1.0  2.610920e-291  1384.158189    True        True    16.566568
# 1.0   6.866703e-11    69.015237    True        True    14.936442
# 1.0  1.765139e-292  1389.577522    True        True    17.183093
# 1.0  1.351102e-291  1385.483398    True        True    17.319038
model.biplot(legend=True, SPE=True, hotellingt2=True)