我有以下的
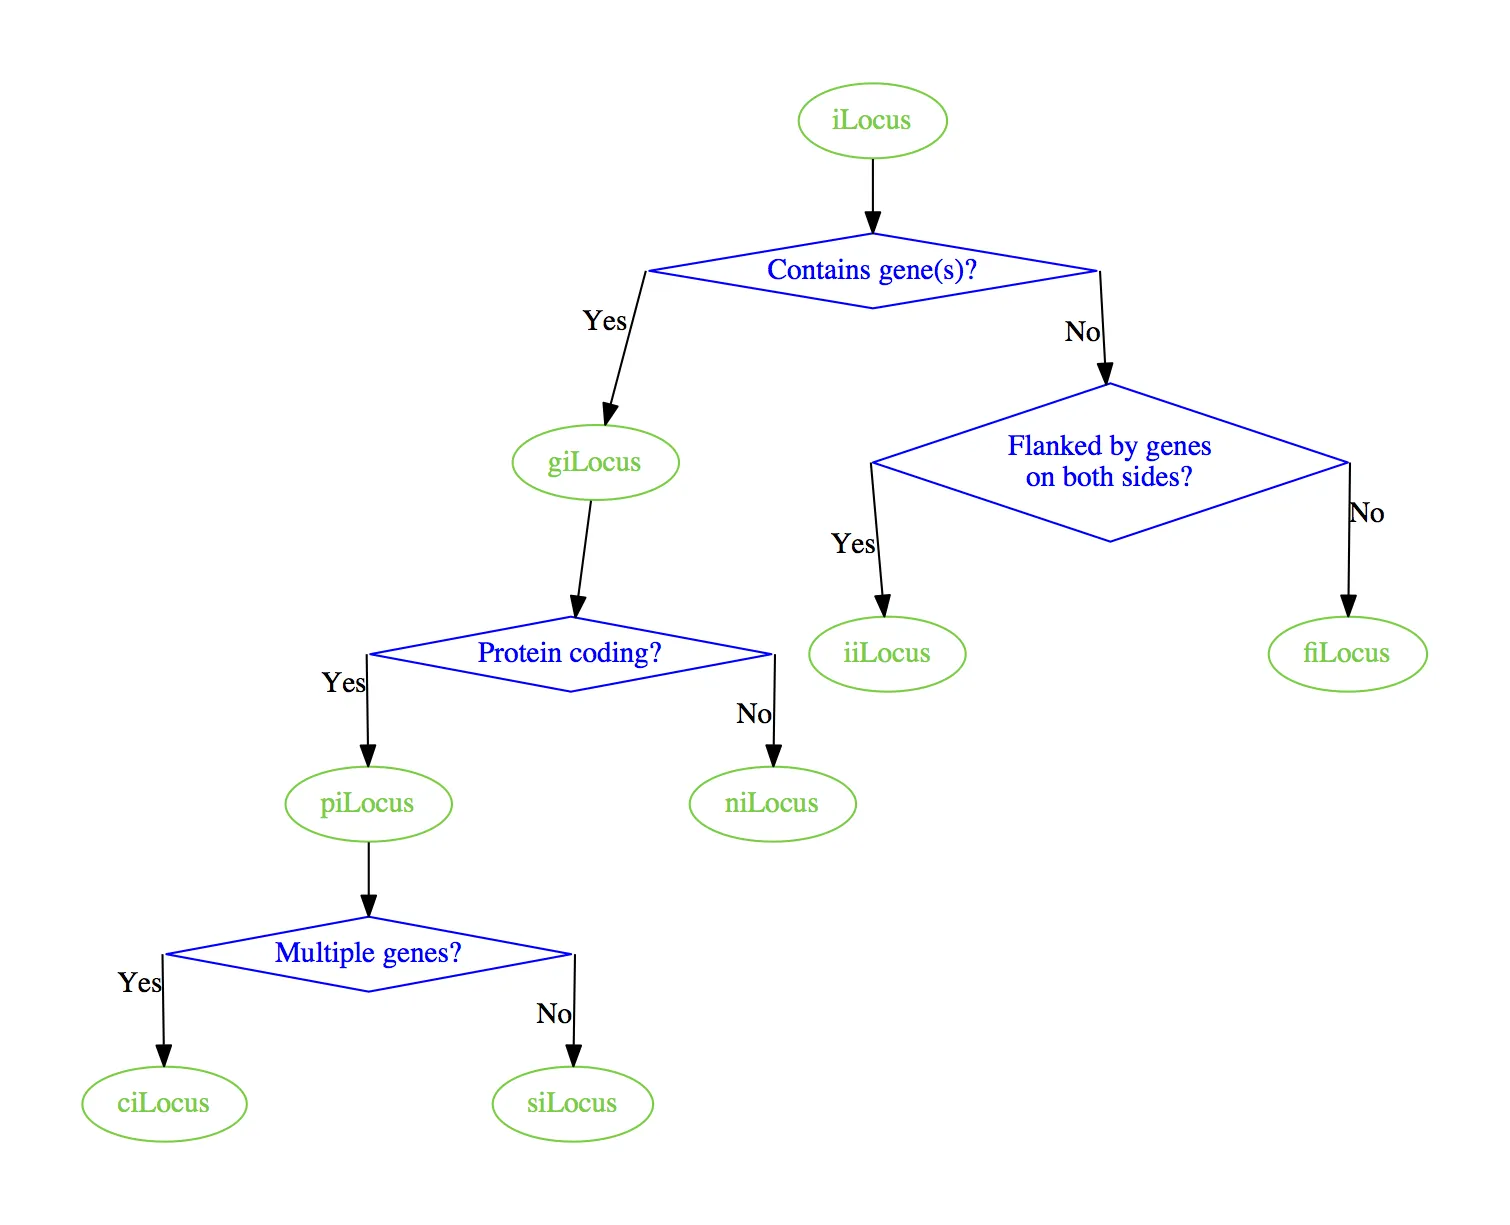
使用graphviz进行渲染,我得到了以下结果。
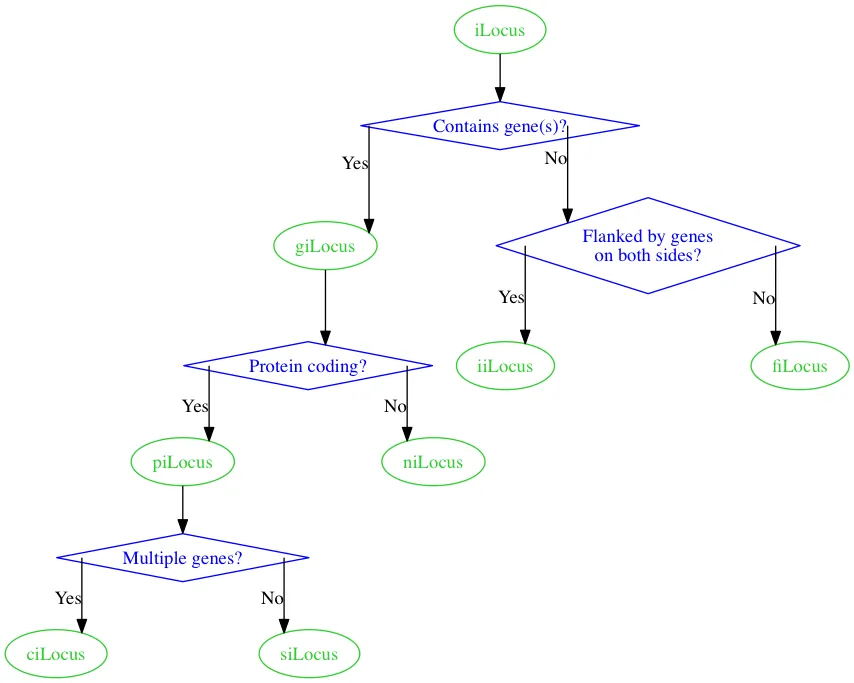
.dot文件。digraph
{
node [color=Limegreen,fontcolor=Limegreen,shape=oval]
ilocus [label="iLocus"]
gilocus [label="giLocus"]
pilocus [label="piLocus"]
nilocus [label="niLocus"]
silocus [label="siLocus"]
cilocus [label="ciLocus"]
filocus [label="fiLocus"]
iilocus [label="iiLocus"]
node [color=Blue,fontcolor=Blue,shape=diamond]
containgene [label="Contains gene(s)?"]
proteincoding [label="Protein coding?"]
multiplegenes [label="Multiple genes?"]
geneflank [label="Flanked by genes\non both sides?"]
ilocus -> containgene
containgene:e -> geneflank [xlabel="No"]
geneflank:e -> filocus [xlabel="No"]
geneflank:w -> iilocus [xlabel="Yes"]
containgene:w -> gilocus [xlabel="Yes"]
gilocus -> proteincoding
proteincoding:e -> nilocus [xlabel="No"]
proteincoding:w -> pilocus [xlabel="Yes"]
pilocus -> multiplegenes
multiplegenes:e -> silocus [xlabel="No"]
multiplegenes:w -> cilocus [xlabel="Yes"]
}
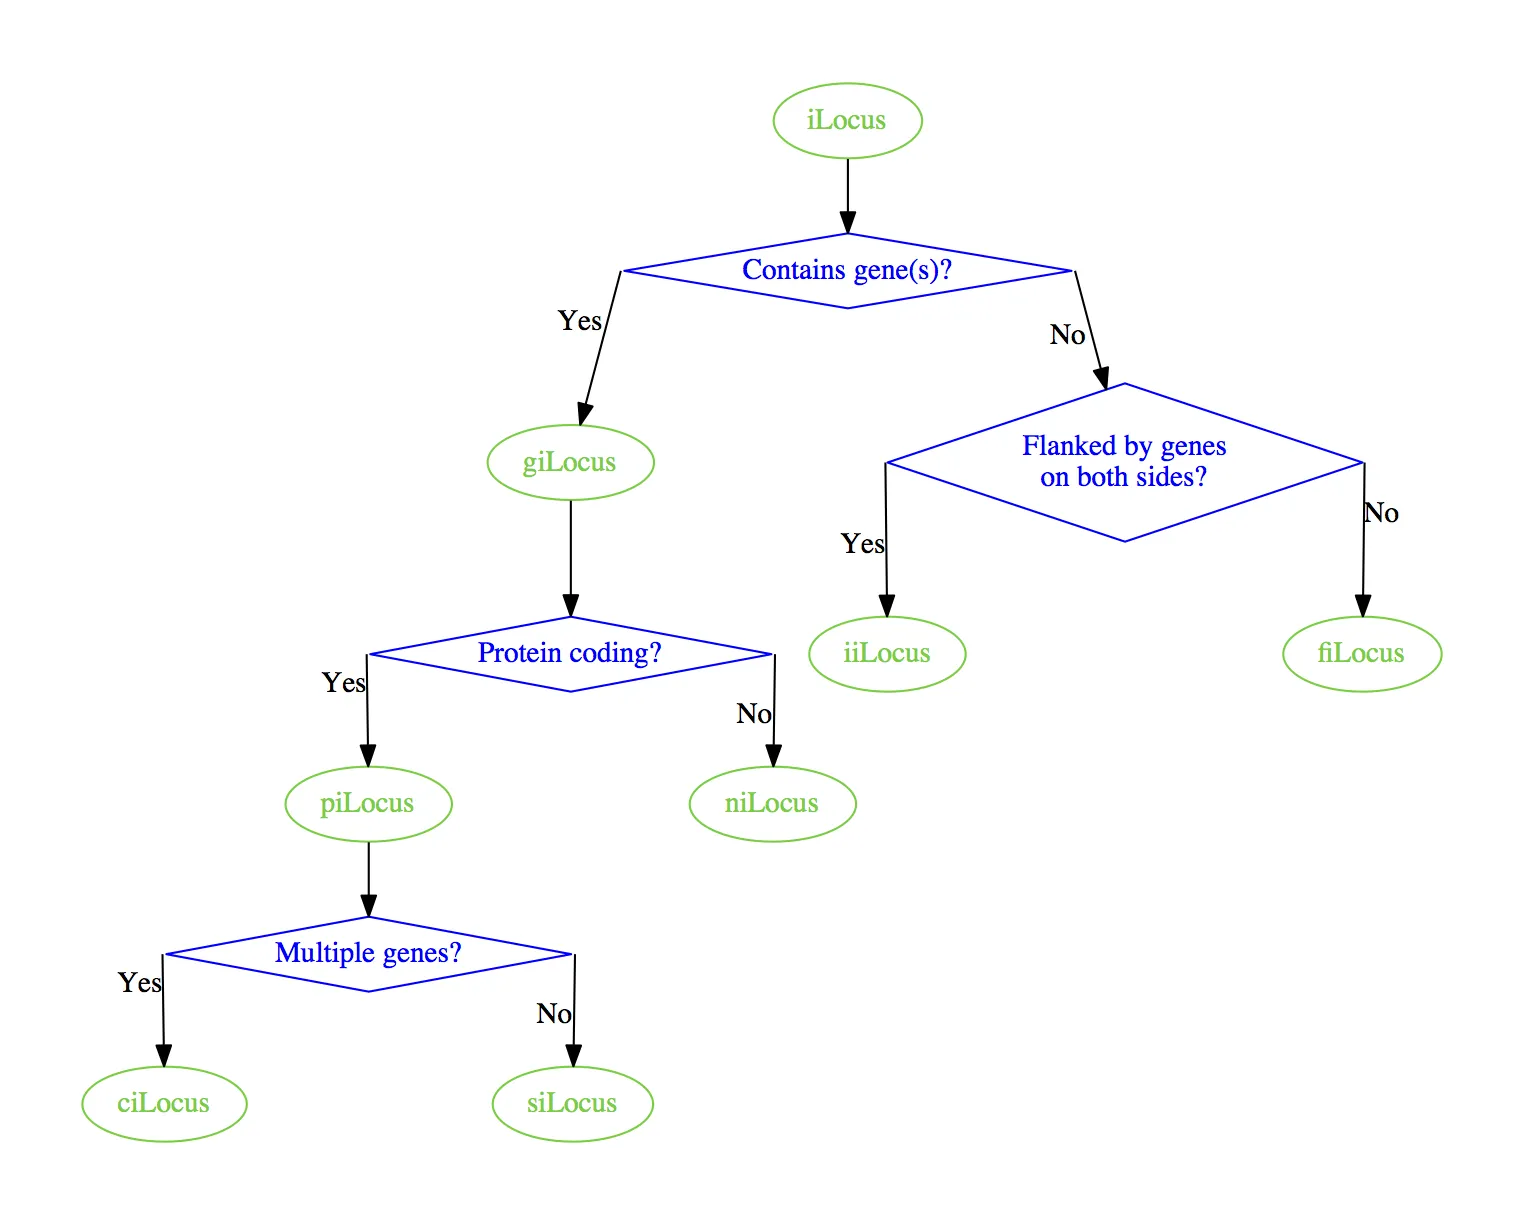
使用graphviz进行渲染,我得到了以下结果。
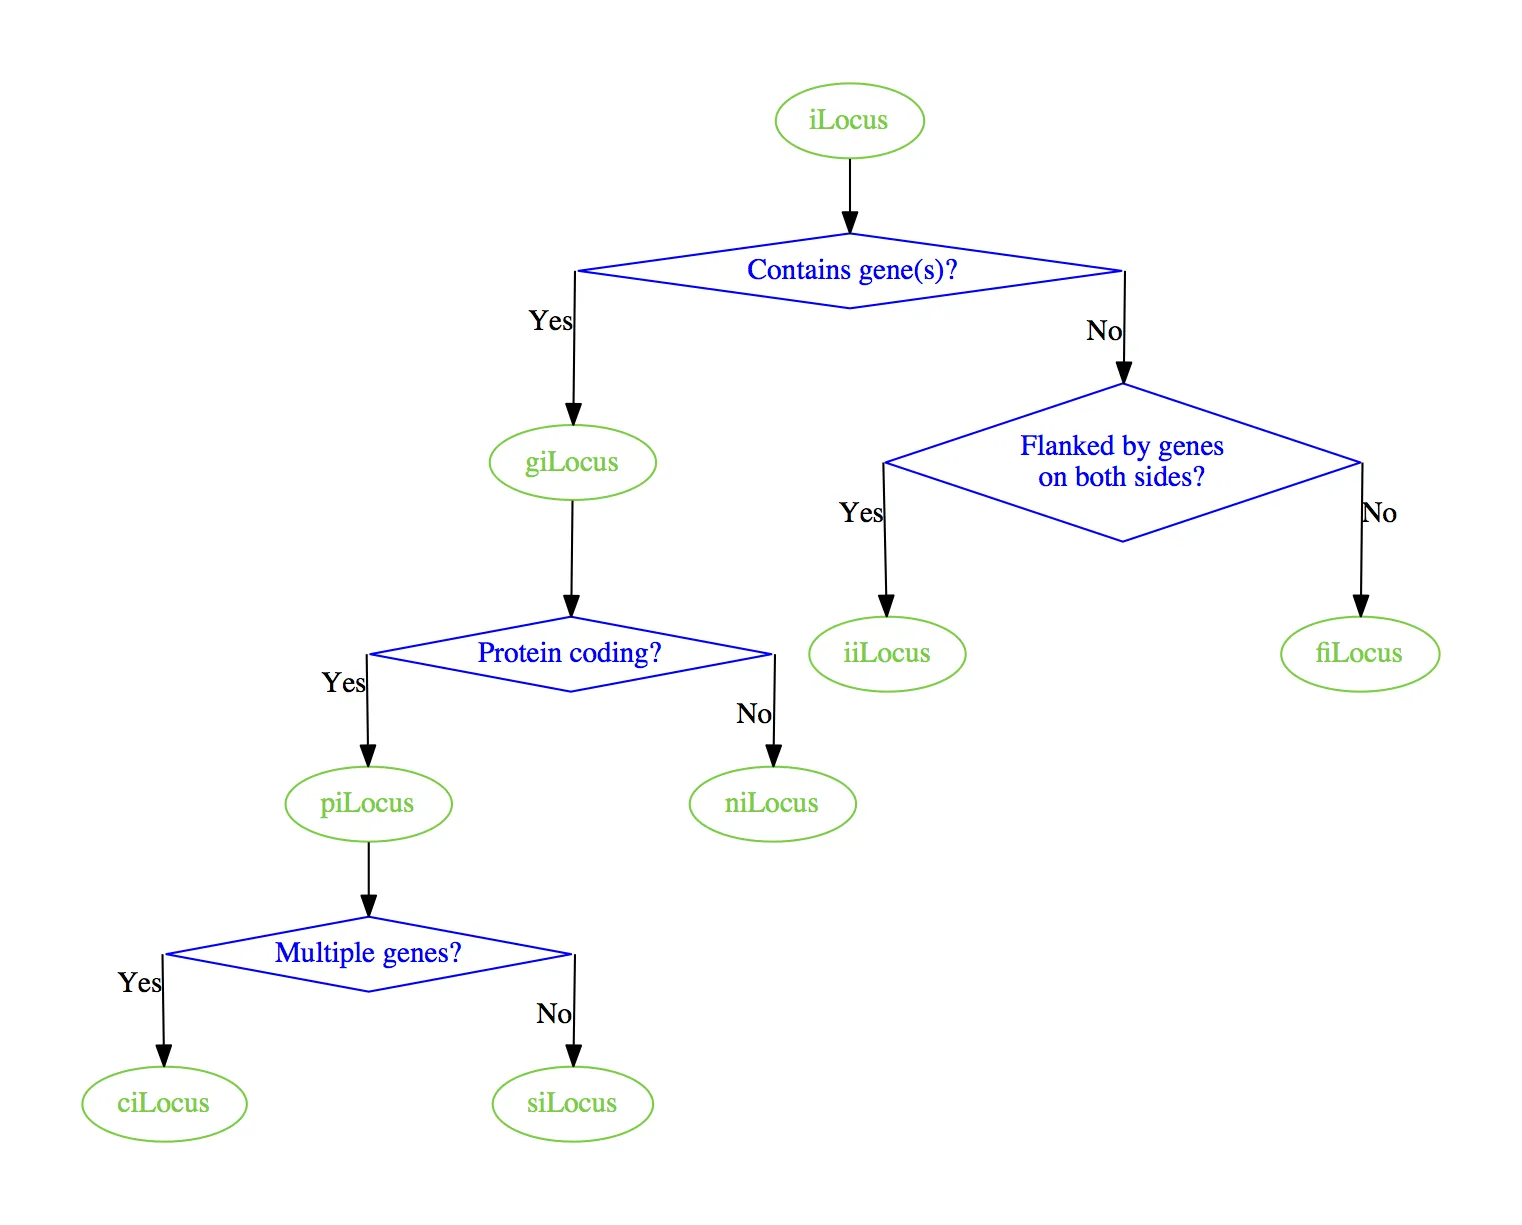
splines=ortho属性原则上似乎是为此设计的,但实际上,当我在我的有向图中添加graph [splines=ortho]时,只会得到直线。
  ------ Multiple genes? -----
  |                          |
  | N                      Y |
  |                          |
  v                          V
siLocus                   ciLocus