GraphViz
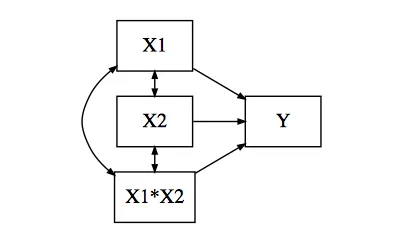
我还建议使用GraphViz的罗盘功能,方法是在边缘上添加:w:
digraph {
graph [rankdir = LR]
node [shape=box]
X1
{X1,X2,a}->Y[arrowsize=0.5]
X1:w->X2:w[constraint=false dir=both arrowsize=0.5]
X2:w->a:w[constraint=false dir=both arrowsize=0.5]
a:w->X1:w[constraint=false dir=both arrowsize=0.5]
}
然而graphviz没有提供调整dot - graphviz version 2.40.1 (20161225.0304)默认端口位置的可能性(据我所知)。在你的情况下,我认为这就是你想做的。
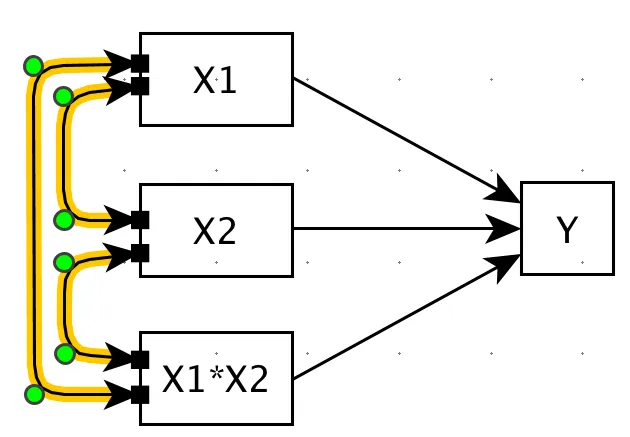
yEd
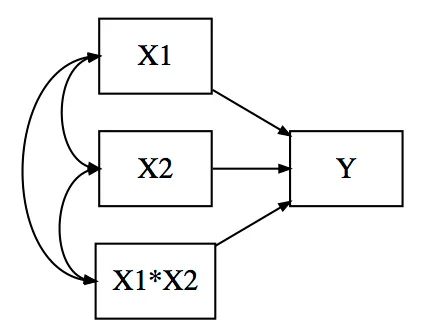
免费但不开源的GUI工具yEd支持此操作:
PSTricks & pst-node
如果你不介意使用LaTeX世界中的一些东西,这里有一个使用pstricks和pst-node包的解决方案:
\documentclass{standalone}
\usepackage{pstricks-add}
\usepackage{auto-pst-pdf}
\usepackage{pst-node}
\begin{document}
\begin{pspicture}
\psset{linewidth=.3pt}
\rput(0,3){\rnode{A}{\psframebox{\makebox[1.1cm]{$X_1$}}}}
\rput(0,2){\rnode{B}{\psframebox{\makebox[1.1cm]{$X_2$}}}}
\rput(0,1){\rnode{C}{\psframebox{\makebox[1.1cm]{$X_1*X_2$}}}}
\rput(2,2){\rnode{D}{\psframebox{\makebox[1.1cm]{$Y$}}}}
\psset{angleA=0, angleB=180, arm=0}
\ncdiag[offsetB=+3pt]{->}{A}{D}
\ncdiag[offsetB=+0pt]{->}{B}{D}
\ncdiag[offsetB=-3pt]{->}{C}{D}
\psset{offset=3pt, angle=180, linearc=.25, armB=12pt}
\ncangle{<->}{A}{B}
\ncangle{<->}{B}{C}
\ncangle[linearc=.3333, armB=18pt]{<->}{C}{A}
\end{pspicture}
\end{document}
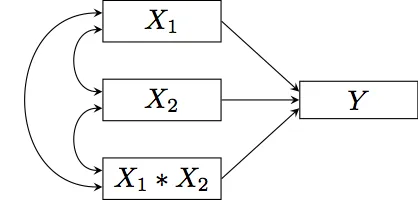
使用命令 $ pdflatex -shell-escape <filename> 将此文档编译为pdf,会得到以下结果:
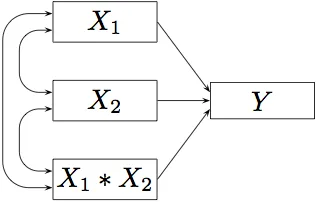
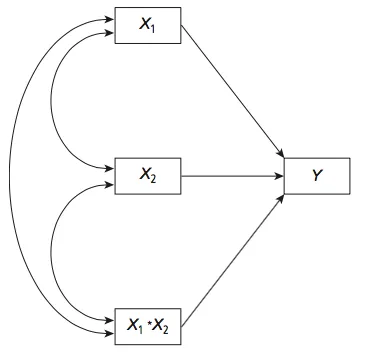
最后,提供一个tikz解决方案。
\documentclass[tikz]{standalone}
\tikzset{>=stealth}
\begin{document}
\begin{tikzpicture}[every node/.style={rectangle,draw,minimum width=1.5cm}]
\node (a) at (0,2) {$X_1$};
\node (b) at (0,1) {$X_2$};
\node (c) at (0,0) {$X_1*X_2$};
\node (d) at (2.5,1) {$Y$};
\tikzset{every edge/.append style={->}}
\path (a.east) edge ([yshift=+3pt]d.west);
\path (b.east) edge ([yshift=+0pt]d.west);
\path (c.east) edge ([yshift=-3pt]d.west);
\tikzset{out=-180,in=180,every edge/.append style={<->,looseness=1.5}}
\path ([yshift=-3pt]a.west) edge ([yshift=+3pt]b.west);
\path ([yshift=-3pt]b.west) edge ([yshift=+3pt]c.west);
\path ([yshift=+3pt]a.west) edge ([yshift=-3pt]c.west);
\end{tikzpicture}
\end{document}