来自ssteve和emden的答案非常有用,已被点赞(感谢两位!)
我正在整合两位的意见,回答更为复杂的问题。我仍然觉得解决方案不是完美的,但这是我目前能够生成的最佳答案。未来提出更好的答案(请参见下面仍缺少的内容),并以可以自动化处理的方式解决较大图版本(请参见问题),替代此答案。
首先,迄今为止总结的最佳解决方案是:将一部分(例如半数)双向边的标签转换为x标签,并随机着色边缘及其相应的标签(通过fontcolor)。
具体而言,以下是此解决方案的一个实例,其中边缘随机为红色、绿色或黑色:
digraph {
size = "6,10.5"
ratio = "fill"
node [shape = circle]
node [fontsize = 24]
edge [fontsize = 24]
{graph [rank=same]
{graph [rank=same]
0 -> 0 [label="6: 0.1764"]
0 -> 4 [xlabel="4: 0.1304" color=blue fontcolor=blue]
0 -> 3 [xlabel="5: 0.1551" color=green fontcolor=green]
0 -> 2 [label="7: 0.1489" color=red fontcolor=red]
0 -> 1 [label="Z: 0.3893"]
4 -> 0 [xlabel="6: 0.1237" color=green fontcolor=green]
4 -> 3 [xlabel="5: 0.05201 " color=green fontcolor=green]
4 -> 2 [xlabel="7: 0.15" color=blue fontcolor=blue]
4 -> 1 [label="Z: 0.4585" color=red fontcolor=red]
3 -> 0 [xlabel="6: 0.1658"]
3 -> 4 [xlabel="4: 0.13" color=red fontcolor=red]
3 -> 3 [label="5: 0.1038" color=blue fontcolor=blue]
3 -> 2 [xlabel="7: 0.1616"]
3 -> 1 [label="Z: 0.4388"]
2 -> 0 [label="6: 0.1661" color=blue fontcolor=blue]
2 -> 4 [xlabel="4: 0.1295" color=red fontcolor=red]
2 -> 3 [label="5: 0.2078" color=green fontcolor=green]
2 -> 2 [label="7: 0.1406"]
2 -> 1 [label="Z: 0.356 "]
1 -> 0 [label="6: 0.1103" color=red fontcolor=red]
1 -> 4 [label="4: 0.2591" color=blue fontcolor=blue]
1 -> 3 [label="5: 0.1382" color=green fontcolor=green]
1 -> 2 [label="7: 0.08581 "]
1 -> 1 [label="Z: 0.1906"]
}
这会产生:
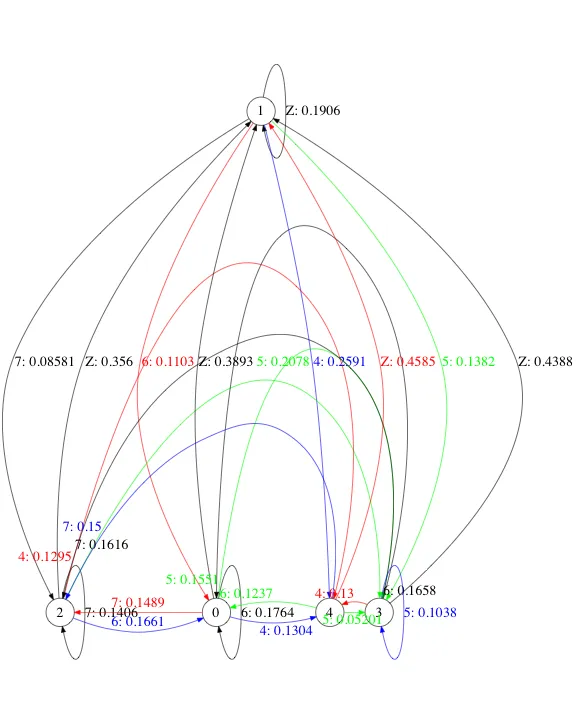
这仍然不完全令人满意,因为:
- 虽然现在更容易将标签追溯到其边缘,但某些标签在使用xlabel时出现在奇怪的位置(例如,在2->4标签上方)。
- 随机选择哪些标签成为xlables似乎是任意的。此外,没有办法(我知道的)保证这总是能奏效。
其他我尝试过的东西:
- 将每个标签都变成x轴标签。结果:所有内容都被压缩在一起,标签重叠并遮挡彼此。
- 对于所有双向边使用x轴标签。结果:与上述问题相同。
- 使用没有颜色的x轴标签。结果:很难追踪哪个标签属于什么。
- 使用ssteve的
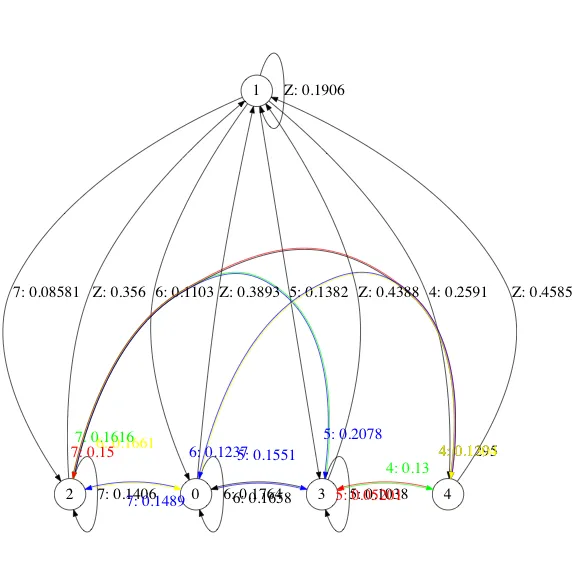
dir="both"+颜色列表solution。随机着色边缘。并且在头部和尾部标签之间随机设置labeldistance在3到11之间,以避免节点处的标签重叠。结果:这更难自动化,并且仍然导致边缘标签重叠和难以追溯到相应边缘的标签。 (见下文)
以下是“我尝试过的其他方法”解决方案列表中最后一项的示例。
size = "6,8.5";
ratio = "fill";
node [shape = circle];
node [fontsize = 24];
edge [fontsize = 24];
{graph [rank=same]; edge[color=invis];1;}
{graph [rank=same]; edge[color=invis];2 -> 0 -> 3 -> 4;}
0 -> 0 [label="6: 0.1764"];
0 -> 4 [dir="both", color="yellow:blue", labeldistance="5", headlabel=<<font color="yellow">4: 0.1304</font>>, taillabel=<<font color="blue">6: 0.1237</font>>];
0 -> 3 [dir="both", color="blue:black", labeldistance="8", headlabel=<<font color="blue">5: 0.1551</font>>, taillabel=<<font color="black">6: 0.1658</font>>];
0 -> 1 [label="Z: 0.3893"];
4 -> 1 [label="Z: 0.4585"];
3 -> 4 [dir="both", color="green:red", labeldistance="5", headlabel=<<font color="green">4: 0.13</font>>, taillabel=<<font color="red">5: 0.05201</font>>];
3 -> 3 [label="5: 0.1038"];
3 -> 1 [label="Z: 0.4388"];
2 -> 0 [dir="both", color="yellow:blue", labeldistance="11", headlabel=<<font color="yellow">6: 0.1661</font>>, taillabel=<<font color="blue">7: 0.1489</font>>];
2 -> 4 [dir="both", color="black:red", labeldistance="5", headlabel=<<font color="black">4: 0.1295</font>>, taillabel=<<font color="red">7: 0.15</font>>];
2 -> 3 [dir="both", color="blue:green", labeldistance="8", headlabel=<<font color="blue">5: 0.2078</font>>, taillabel=<<font color="green">7: 0.1616</font>>];
2 -> 2 [label="7: 0.1406"];
2 -> 1 [label="Z: 0.356 "];
1 -> 0 [label="6: 0.1103"];
1 -> 4 [label="4: 0.2591"];
1 -> 3 [label="5: 0.1382"];
1 -> 2 [label="7: 0.08581 "];
1 -> 1 [label="Z: 0.1906"];
}
这会产生:
其他想法/改进征集中...
 还有其他想法吗?我正在生成相同问题的较大图表,因此最佳解决方案不应完全是手动放置边缘/标签的临时解决方案。
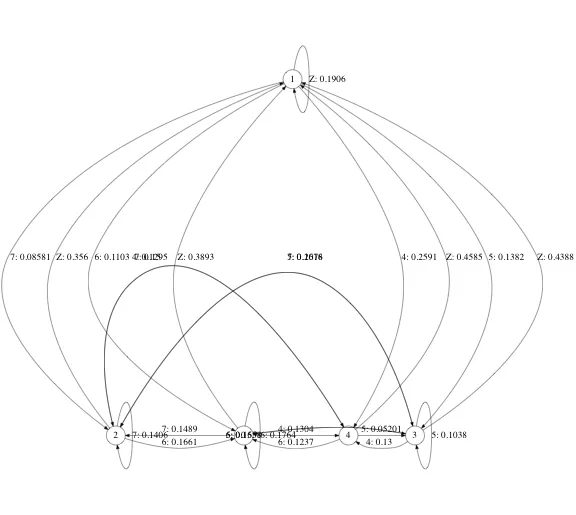 它展示了与上面简单示例中相同的边/标签重叠问题。