使用
stargazer创建表格时,我想在自由度(见下文:括号前)之前添加一个新行。有人可以帮我正确调用吗?我在包文档中找不到它。(抱歉没有创建可重现的代码,我不知道如何使用虚假数据模拟回归。我希望有人仍然能帮助我!)

stargazer创建表格时,我想在自由度(见下文:括号前)之前添加一个新行。有人可以帮我正确调用吗?我在包文档中找不到它。(抱歉没有创建可重现的代码,我不知道如何使用虚假数据模拟回归。我希望有人仍然能帮助我!)
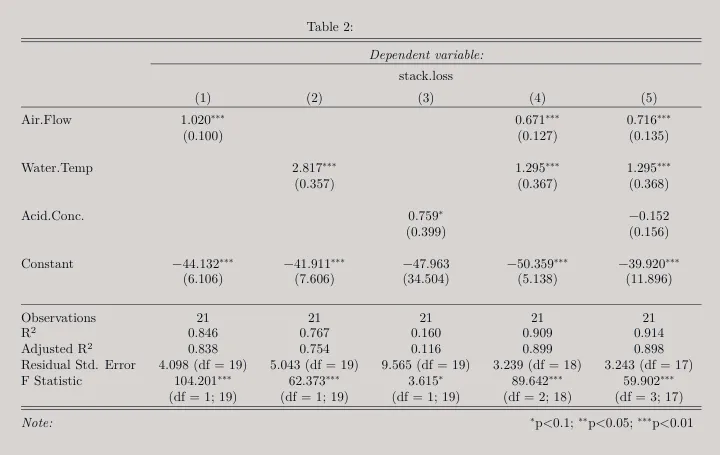
stargazer()的输出以制作所需的表格。此答案中的用户定义函数(show_F_in_two_lines())将生成如下所示的表格。
library(stringr)

show_F_in_two_lines <- function(stargazer) {
  # `Stringr` works better than base's regex
  require(stringr)

  # If you remove `capture.output()`, not only the modified LaTeX code
  # but also the original code would show up
  stargazer <- stargazer |>
    capture.output()

  # Reuse the index in which F-statistics are displayed
  position_F <- str_which(stargazer, "F Statistic")

  # Extract only F-statistics
  Fs <- stargazer[position_F] |>
    str_replace_all("\\(.*?\\)", "")

  # Extract only df values and make a new line for them
  dfs <- stargazer[position_F] |>
    str_extract_all("\\(.*?\\)") |>
    unlist() |>
    (
      \(dfs)
      paste0(" & ", dfs, collapse = "")
    )() |>
    paste0(" \\\\")

  # Reuse table elements that are specified
  # after the index of F-statistics
  after_Fs <- stargazer[-seq_len(position_F)]

  c(
    stargazer[seq_len(position_F - 1)],
    Fs,
    dfs,
    after_Fs
  ) |>
    cat(sep = "\n")
}

stargazer(
  header = FALSE,
  lm.out.1,
  lm.out.2,
  lm.out.3,
  lm.out.4,
  lm.out.5
) |>
  show_F_in_two_lines()
mtcars。这篇文章也许会有所帮助:最小可重现示例。 - Vincent