我还没有找到一个完美的解决方案,但是有一种将其集成到stargazer中的方法。
lmp <- function (modelobject) {
if (class(modelobject) != "lm") stop("Not an object of class 'lm' ")
f <- summary(modelobject)$fstatistic
p <- pf(f[1],f[2],f[3],lower.tail=F)
attributes(p) <- NULL
return(format.pval(p, eps = .001, digits = 3))
}
这段文字涉及到IT技术方面的内容。建议使用
omit.stat=c("f") 命令去除 stargazer 中的 F-statistic,并使用
add.lines() 手动添加它。注意,默认情况下,
add.lines() 会在统计数据前添加信息。如果需要更改顺序,可以使用
table.layout 命令,参考
https://rdrr.io/cran/stargazer/man/stargazer_table_layout_characters.html。请注意保留 html 标签。
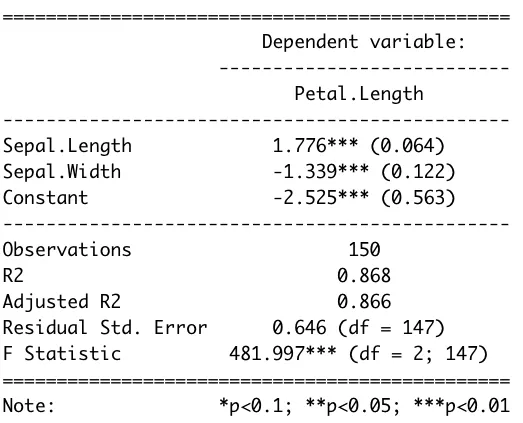
iris_reg<-lm(Petal.Length~Sepal.Length+Sepal.Width, data=iris)
summary(iris_reg)
stargazer(iris_reg,
header=FALSE,
single.row=TRUE,
type="text",
add.lines=list(c("F Statistic (p-value)",lmp(iris_reg))),
omit.stat = c("f"),
table.layout = "=ldc-tsa-n")
=================================================
Dependent variable:
---------------------------
Petal.Length
-------------------------------------------------
Sepal.Length 1.776*** (0.064)
Sepal.Width -1.339*** (0.122)
Constant -2.525*** (0.563)
Observations 150
R2 0.868
Adjusted R2 0.866
Residual Std. Error 0.646 (df = 147)
F Statistic (p-value) <0.001
-------------------------------------------------
Note: *p<0.1; **p<0.05; ***p<0.01
如果您想在同一个stargazer中使用多个模型,请使用lapply,如JWilliman的答案所示https://dev59.com/nJvga4cB1Zd3GeqP68Xd#64745465
iris_reg2<-list(
lm(Petal.Length~Sepal.Length+Sepal.Width, data=iris),
lm(Petal.Length~Sepal.Length+Sepal.Width+factor(Species), data=iris)
)
stargazer(iris_reg2,
header=FALSE,
single.row=TRUE,
type="text",
add.lines=list(c("F Statistic (p-value)",unlist(lapply(iris_reg2,lmp)))),
omit.stat = c("f"),
table.layout = "=ldc-tsa-n")
=============================================================
Dependent variable:
-----------------------------------
Petal.Length
-------------------------------------------------------------
Sepal.Length 1.776*** (0.064) 0.646*** (0.054)
Sepal.Width -1.339*** (0.122) -0.041 (0.081)
factor(Species)versicolor 2.170*** (0.107)
factor(Species)virginica 3.049*** (0.123)
Constant -2.525*** (0.563) -1.634*** (0.268)
Observations 150 150
R2 0.868 0.975
Adjusted R2 0.866 0.974
Residual Std. Error 0.646 (df = 147) 0.283 (df = 145)
F Statistic (p-value) <0.001 <0.001
-------------------------------------------------------------
Note: *p<0.1; **p<0.05; ***p<0.01