R Stargazer软件包输出:felm回归(lfe软件包)缺少F统计量。

3
我试图使用 stargazer 包输出回归结果。我使用 lfe 包中的 felm 进行回归。除了 F 统计量的值保持为空白外,stargazer 输出表格正常显示所有内容。但是,这个问题不会在 lm 结果中出现。

什么是原因?如何让我的 felm 回归的 F 统计量值出现在 stargazer 输出中?

我知道我可以手动添加一行来显示 F 值,但如果可能的话,我更愿意采用更自动化的方法。

以下是使用提供的数据样本代码 here

library(foreign)
temp_dat <- read.dta("http://www.kellogg.northwestern.edu/faculty/petersen/htm/papers/se/test_data.dta")

temp_lm <- lm(y ~ x, temp_dat)
temp_felm <- felm(y ~ x, temp_dat)

library(stargazer)
stargazer(temp_lm, temp_felm, type = "text")
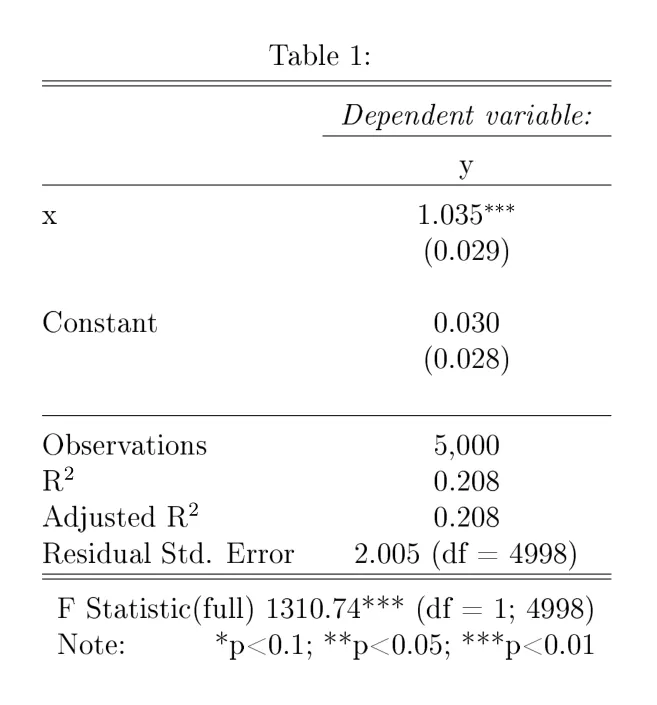
输出:

====================================================================
                                        Dependent variable:         
                                ------------------------------------
                                                 y                  
                                            OLS               felm  
                                            (1)               (2)   
--------------------------------------------------------------------
x                                        1.035***           1.035***
                                          (0.029)           (0.029) 

Constant                                   0.030             0.030  
                                          (0.028)           (0.028) 

--------------------------------------------------------------------
Observations                               5,000             5,000  
R2                                         0.208             0.208  
Adjusted R2                                0.208             0.208  
Residual Std. Error (df = 4998)            2.005             2.005  
F Statistic                     1,310.740*** (df = 1; 4998)         
====================================================================
Note:                                    *p<0.1; **p<0.05; ***p<0.01

2个回答

3

stargazer 中似乎没有自动化的方法,这是一个好的包,但不可扩展。选项 keep.stat = "f" 不会为 felm 对象生成 f 统计量。然而,texreg 有一个选项可以包括 felm 对象的 f 统计量。

library(foreign);library(texreg);library(lfe)
temp_dat <- read.dta("http://www.kellogg.northwestern.edu/faculty/petersen/htm/papers/se/test_data.dta")

temp_lm <- lm(y ~ x, temp_dat)
temp_felm <- felm(y ~ x, temp_dat)

screenreg(list(temp_lm, temp_felm), include.fstatistic = T)

输出:

==================================================
                          Model 1      Model 2    
--------------------------------------------------
(Intercept)                  0.03         0.03    
                            (0.03)       (0.03)   
x                            1.03 ***     1.03 ***
                            (0.03)       (0.03)   
--------------------------------------------------
R^2                          0.21                 
Adj. R^2                     0.21                 
Num. obs.                 5000         5000       
F statistic               1310.74                 
RMSE                         2.01                 
R^2 (full model)                          0.21    
R^2 (proj model)                          0.21    
Adj. R^2 (full model)                     0.21    
Adj. R^2 (proj model)                     0.21    
F statistic (full model)               1310.74    
F (full model): p-value                   0.00    
F statistic (proj model)               1310.74    
F (proj model): p-value                   0.00    
==================================================
*** p < 0.001, ** p < 0.01, * p < 0.05

createTexreg函数允许你选择特定的统计数据来提取和显示。你需要先编写一个小函数,从summary.felm对象中提取对象,然后将其转换为texreg对象。

extract.felm <- function(model, include.f.full = TRUE, 
                         include.f.proj = TRUE,
                         include.rsquared = TRUE,
                         include.adjrs = TRUE, 
                         include.nobs = TRUE, ...) {

   s <- summary(model, ...)
   names <- rownames(s$coefficients)
   co <- s$coefficients[, 1]
   se <- s$coefficients[, 2]
   pval <- s$coefficients[, 4]

    gof <- numeric()
    gof.names <- character()
    gof.decimal <- logical()
    if (include.rsquared == TRUE) {
      rs <- s$r.squared
      gof <- c(gof, rs)
      gof.names <- c(gof.names, "R$^2$")
      gof.decimal <- c(gof.decimal, TRUE)
      }
   if (include.adjrs == TRUE) {
     adj <- s$adj.r.squared
     gof <- c(gof, adj)
     gof.names <- c(gof.names, "Adj.\\ R$^2$")
     gof.decimal <- c(gof.decimal, TRUE)
     }
   if (include.nobs == TRUE) {
     n <- s$N
     gof <- c(gof, n)
     gof.names <- c(gof.names, "Num.\\ obs.")
     gof.decimal <- c(gof.decimal, FALSE)
   }
    if (include.f.full == TRUE) {
      ffs <- s$fstat
      ffpval <- round(s$F.fstat[4],4)
      gof <- c(gof, ffs, ffpval)
      gof.names <- c(gof.names, "F statistic (Full model)", "F (full model): p-value")
      gof.decimal <- c(gof.decimal, TRUE, TRUE)
    }
    if (include.f.proj == TRUE) {
      fps <- s$P.fstat[5]
      fppval <- s$P.fstat[4]
      gof <- c(gof, fps, fppval)
      gof.names <- c(gof.names, "F statistic (proj. model)", "F (proj. model): p-value") #Modify the names as you see fit
      gof.decimal <- c(gof.decimal, TRUE, TRUE)
    }
     tr <- createTexreg(
       coef.names = names,
       coef = co,
       se = se,
       pvalues = pval,
       gof.names = gof.names,
       gof = gof,
       gof.decimal = gof.decimal
       )
   return(tr)
   }
setMethod("extract", signature = className("felm", "stats"),
             definition = extract.felm)

现在,运行该函数,将参数include.f.prof = F设置,并将其发送给screenreg:

> m <- extract.felm(temp_felm, include.f.proj = F)
> screenreg(list(temp_lm, m))

==================================================
                          Model 1      Model 2    
--------------------------------------------------
(Intercept)                  0.03         0.03    
                            (0.03)       (0.03)   
x                            1.03 ***     1.03 ***
                            (0.03)       (0.03)   
--------------------------------------------------
R^2                          0.21         0.21    
Adj. R^2                     0.21         0.21    
Num. obs.                 5000         5000       
RMSE                         2.01                 
F statistic (Full model)               1310.74    
F (full model): p-value                   0.00    
==================================================
*** p < 0.001, ** p < 0.01, * p < 0.05

谢谢。我从未使用过“texreg”,但这看起来非常有帮助。然而,这种方式不必要地扩展了表格的高度 - 你知道是否有一种方法可以将不同类型模型的R ^ 2和F统计值排列在单行中,而不是它们占据不同的行吗? - Learner Yoda
幸运的是,texreg 是高度可扩展的。我建议查看手册以了解如何使用 createTexreg 函数。我将在上面添加一个函数来完成这个任务。 - paqmo

1
这里有一个不完全令人满意的解决方案,希望能对你有所帮助。从 lfe:::summary.felm 中获取 F 统计量:
(Fstat <- summary(temp_felm)$F.fstat)

###############
            F           df1           df2             p 
 1.310740e+03  1.000000e+00  4.998000e+03 4.252163e-255

然后在使用 stargazer 生成的表格注释中添加 F 统计量:

stars <- ifelse(Fstat[4]<0.01,"***",ifelse(Fstat[4]<0.05,"**",ifelse(Fstat[4]<0.1,"*","")))
notes <- c(paste("F Statistic(full) \\hfill      ", round(Fstat[1],3),stars," (df = ",Fstat[2],"; ", Fstat[3],")",sep=""),
"Note:\\hfill *p<0.1; **p<0.05; ***p<0.01")

stargazer(temp_felm, notes=notes, notes.append=F, notes.label="", notes.align="l")

最终的LaTeX表格如下: enter image description here


我的表格中大约会有8个模型。在注释部分插入所有F值可能并不是非常有用的。但是你的解决方案给了我另一个想法——我可以提取所有模型的F值,将它们插入到向量中,然后使用add.line。这需要一些努力,并不完全自动化,但似乎比根本没有F值要好。 - Learner Yoda

网页内容由stack overflow 提供, 点击上面的
可以查看英文原文,
原文链接